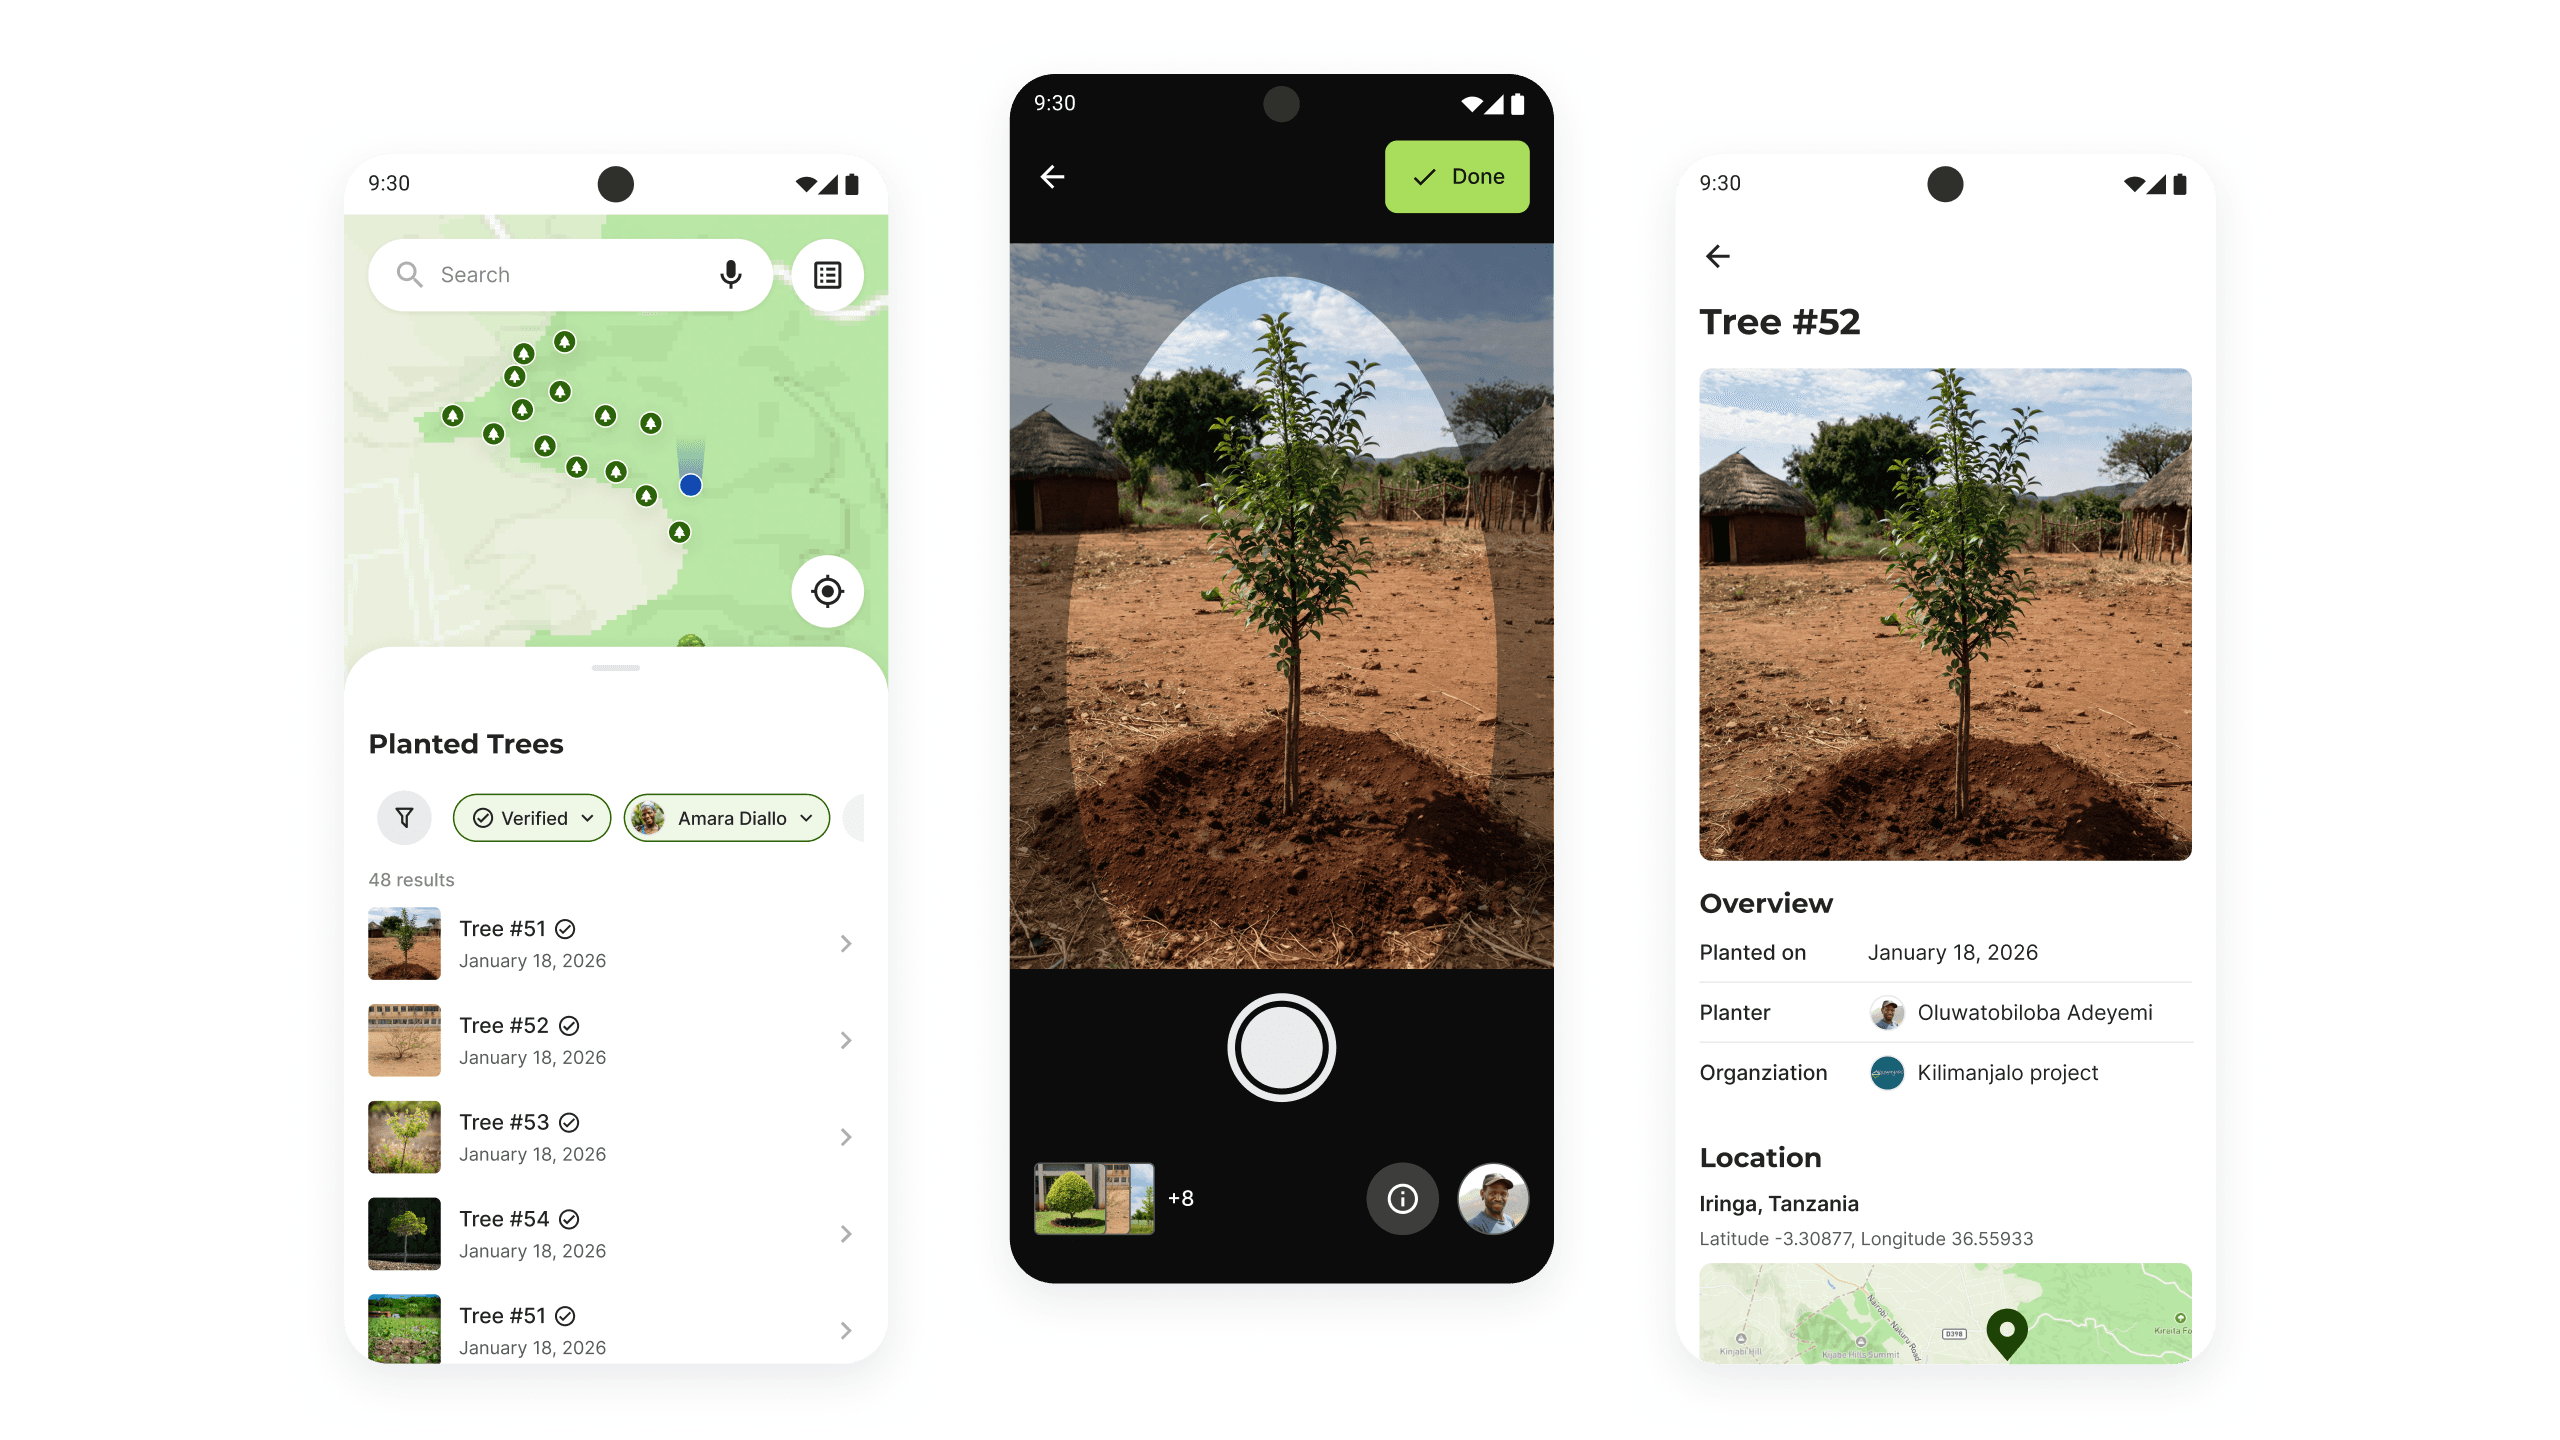
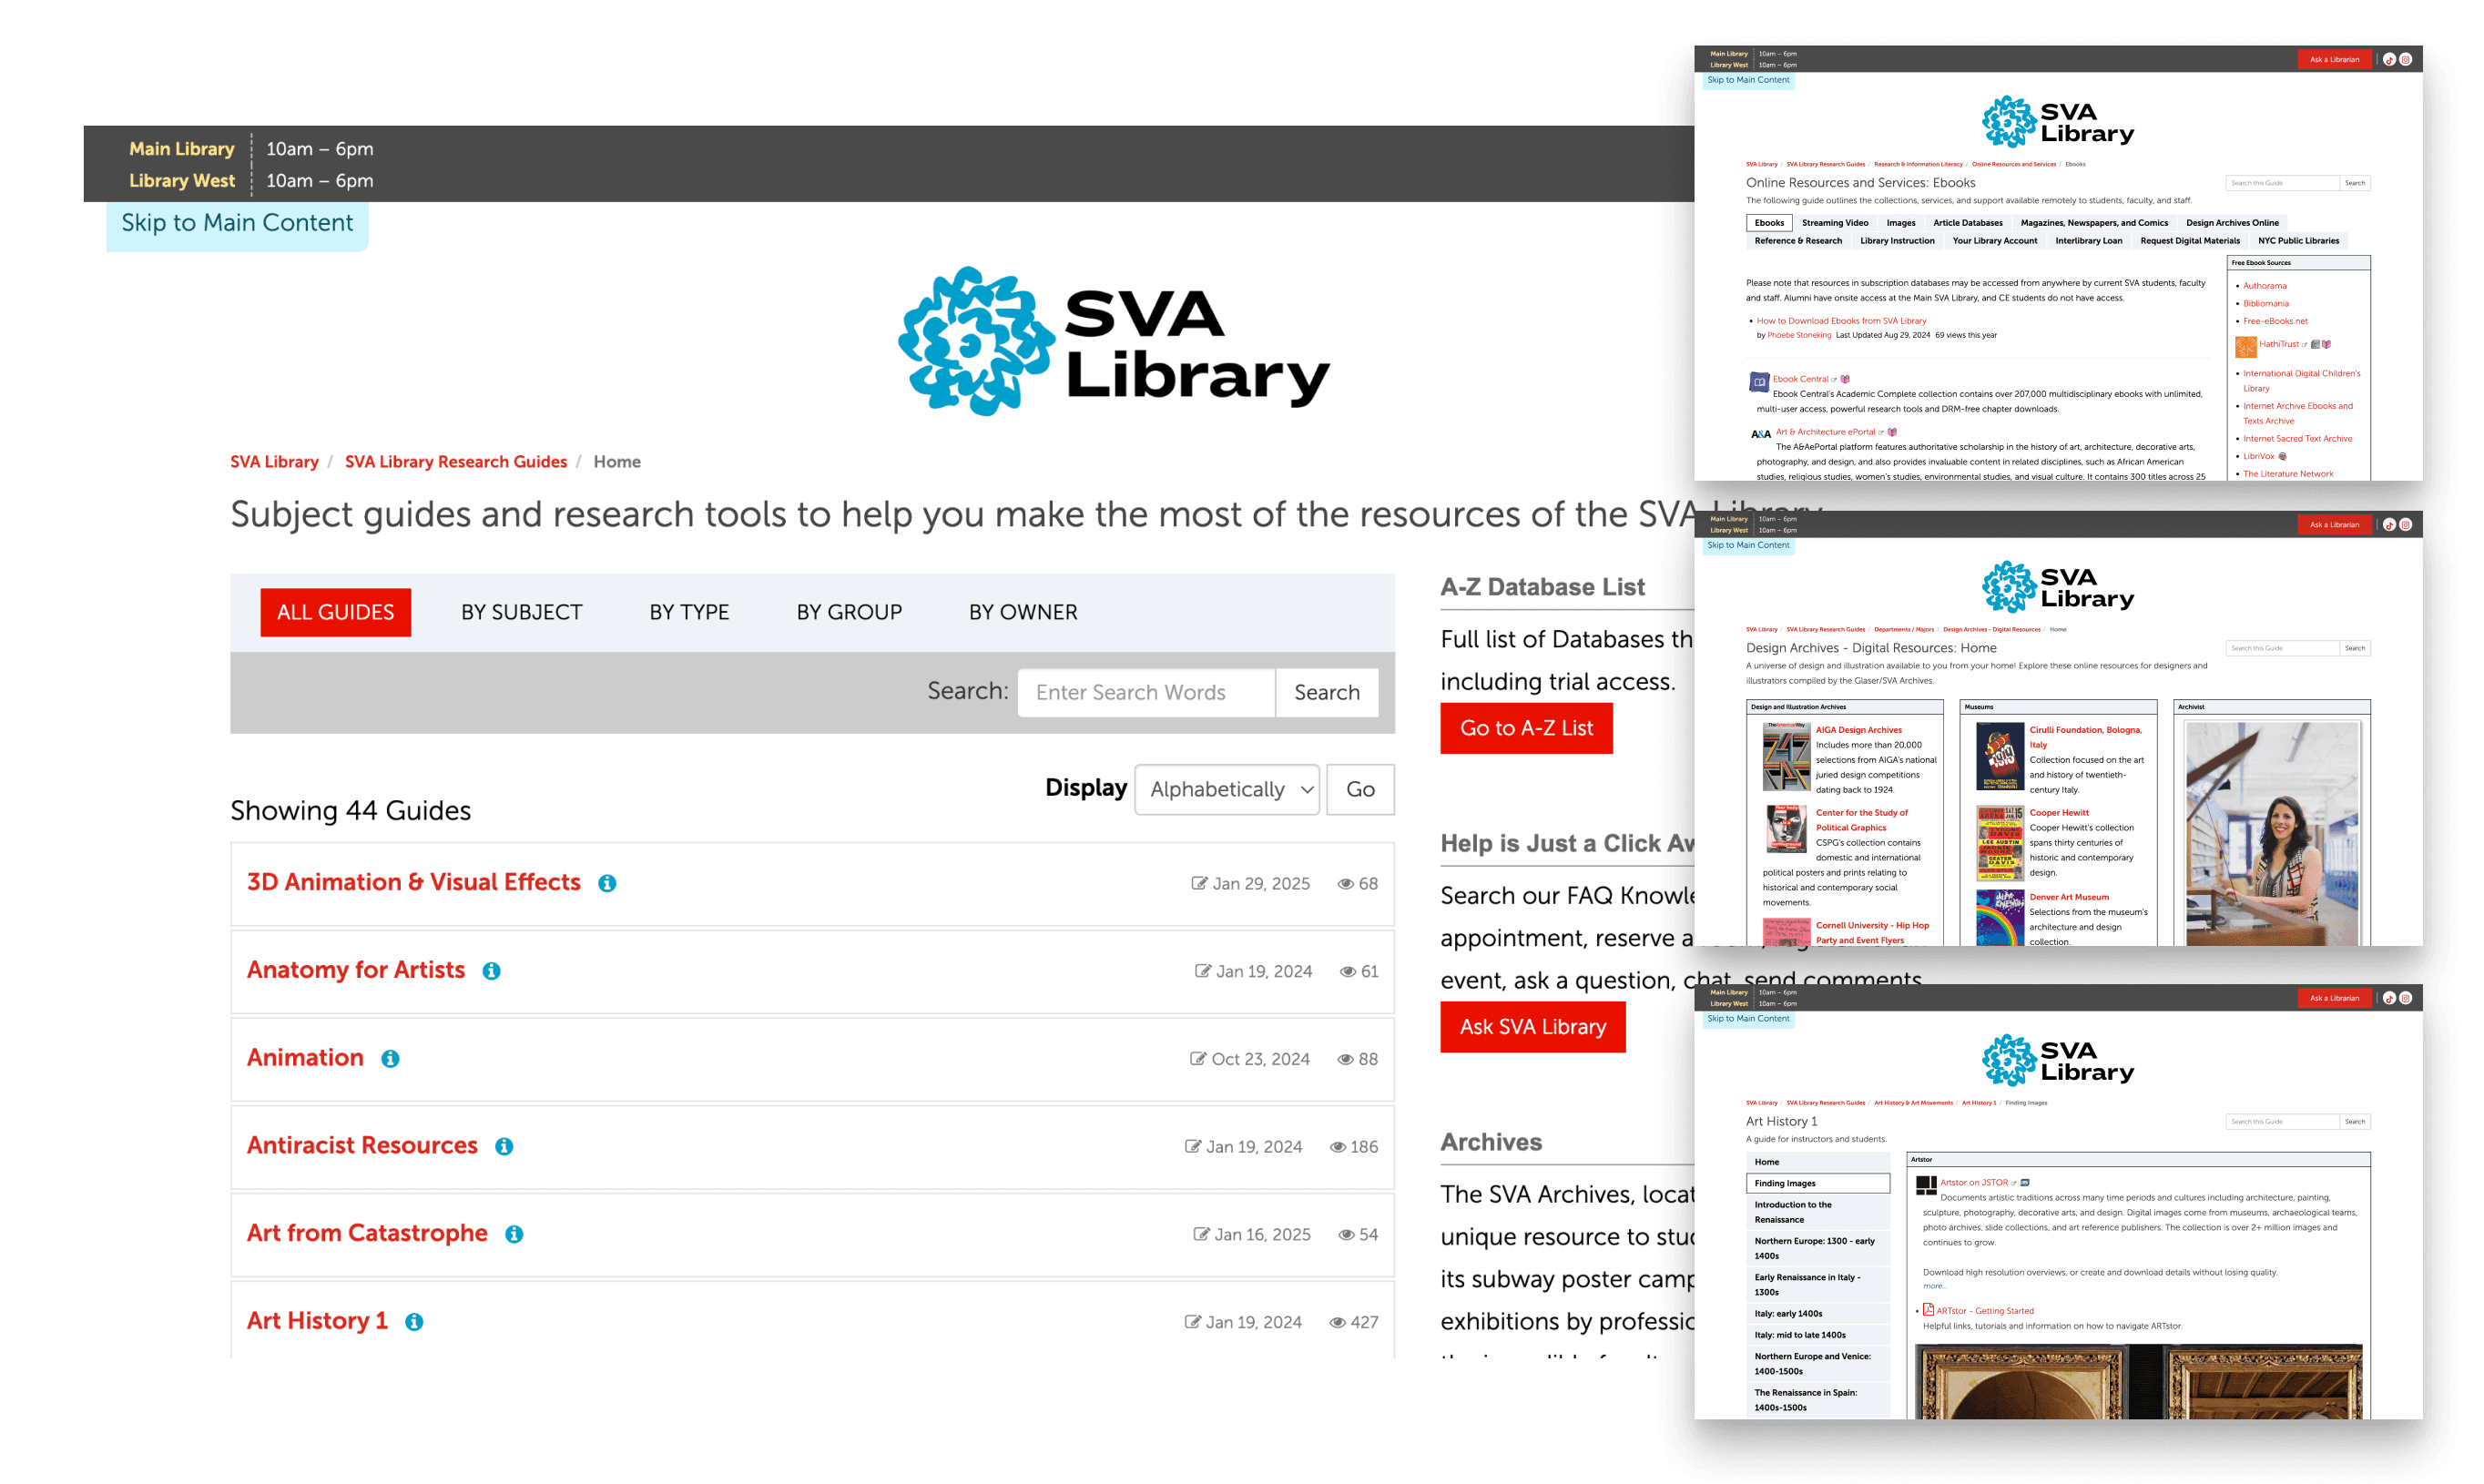
The School of Visual Arts (SVA) is a leading art and design college in NYC. Its library offers 44 unique research guide pages to help students start their research with curated resources and tips across various subjects.
Uncovering how digital-native students discover research resources on the library website and addressing their needs
Client & Scope
The School of Visual Arts (SVA) is a leading art and design college in NYC. Its library offers 44 unique research guide pages to help students start their research with curated resources and tips across various subjects.
Problem
SVA Library faced a high volume of inquiries and aimed to make its services more self-serve, reducing reliance on direct librarian support. It also hoped to increase effective use of research guides, but a lack of insight into how users navigate the site made it challenging to improve.
Goal
Challenge
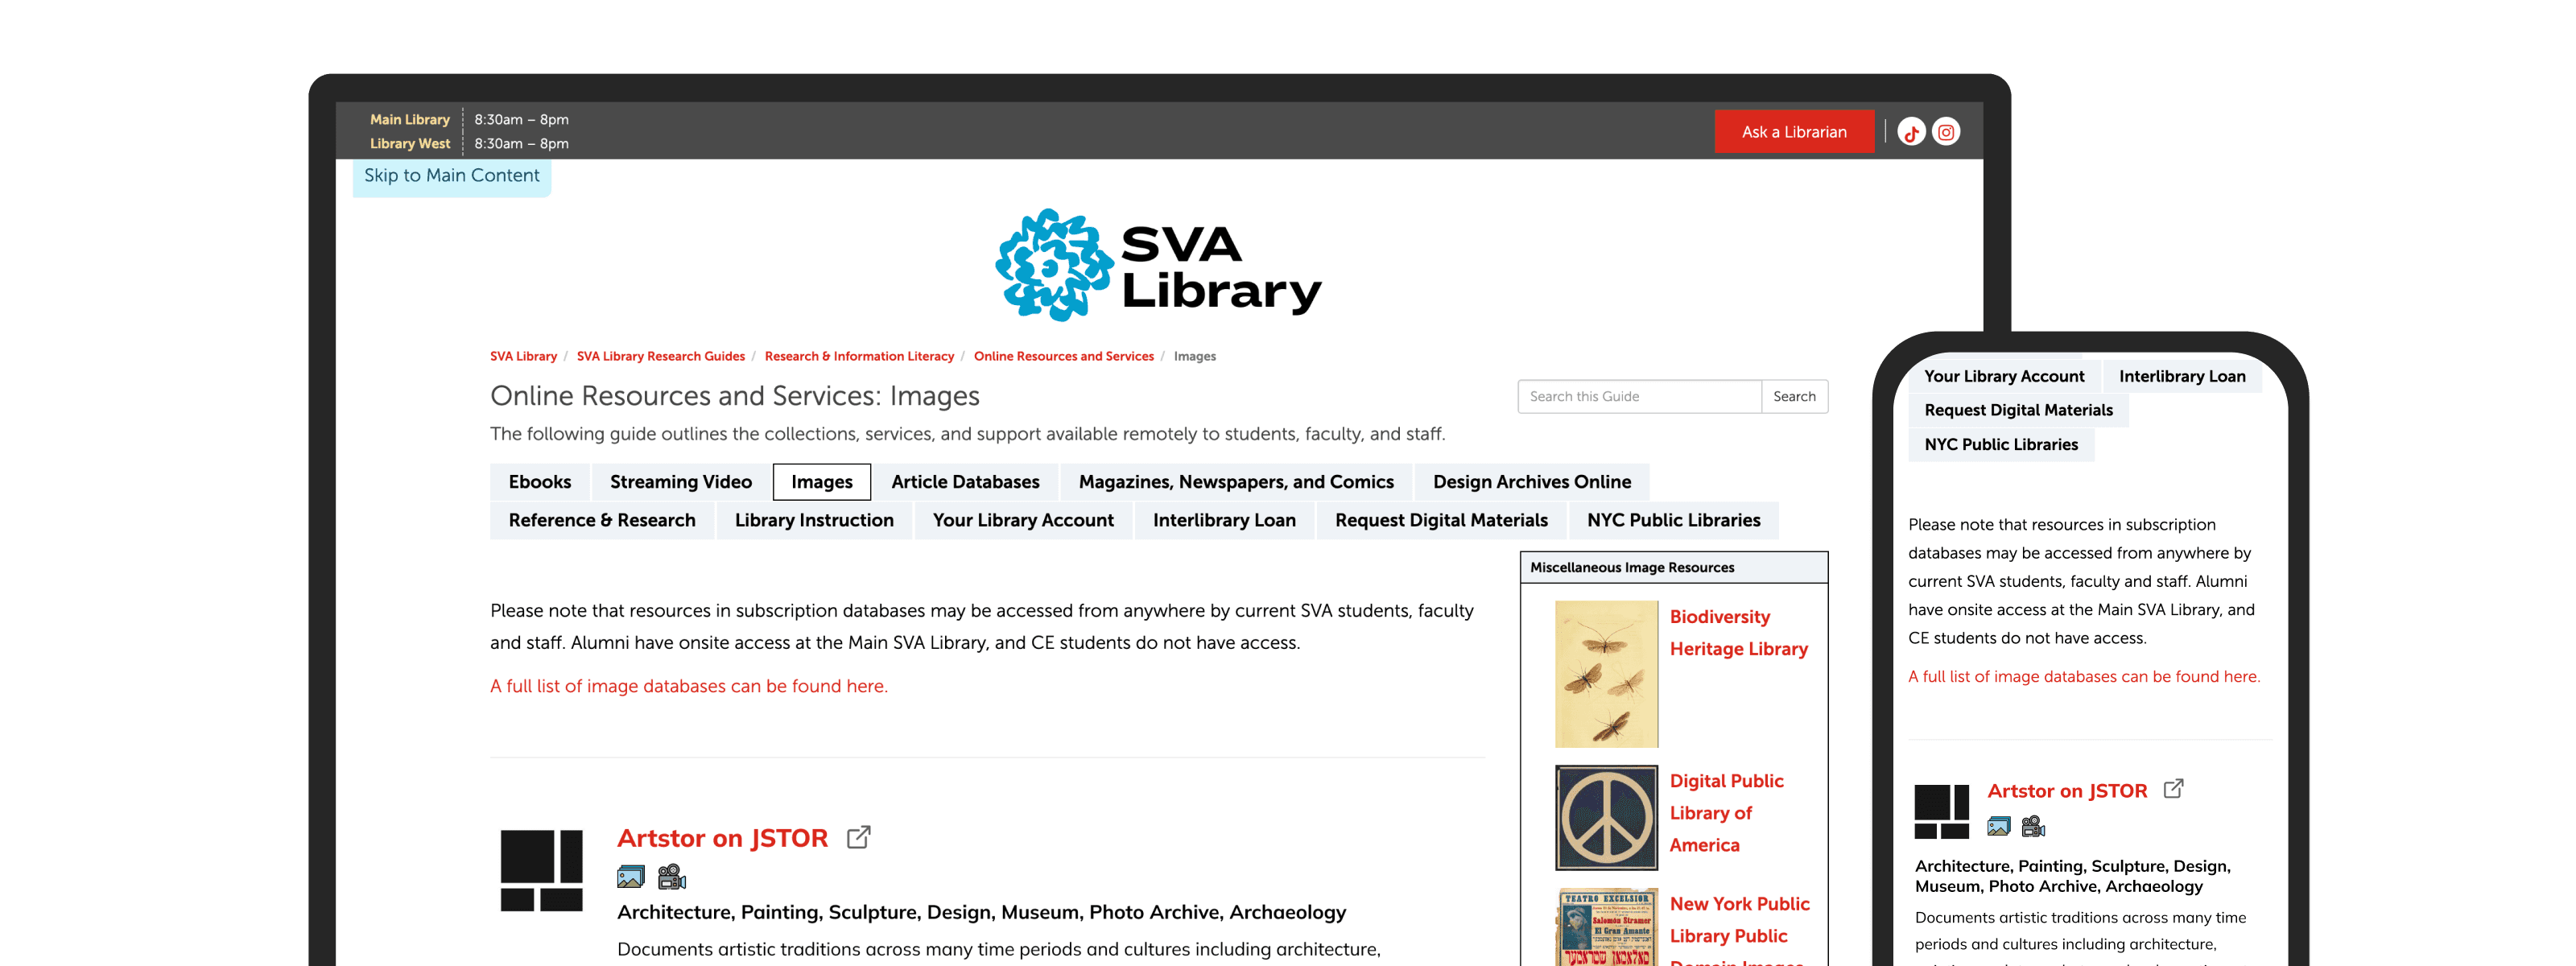
As part of the school-wide website, SVA Library had limited control over page components, functionality, and style. These constraints had to be considered to ensure our UX recommendations' feasibility.
Each research guide covered different topics, with varying layouts and purposes. The users and use cases are also diverse from students to faculties. We had to consider how to make the most impact within our limited time.
Methodology
Used behavioral research methods to understand how users navigate.

We chose eye-tracking because it is well-suited to the client's need to get insights into natural user behavior.

After seeing natural behavior using eye-tracking, we conducted interviews, using the RTA methods to gain insight into behaviors observed.


We recruited college students, who are the primary users, through personal networks, school mailing lists and on-site recruiting.
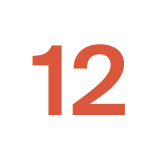
We conducted 12 sessions (8 desktops and 4 mobiles).
Scenario & Tasks
To deliver the most impact within a limited timeframe, we selected the most frequently used and easily templatized pages for our testing scope. We designed tasks to reflect early-stage research scenarios, aligning with the guide's intent. In both tasks, participants were asked to find resources relevant to a prompt using the descriptions on the pages.
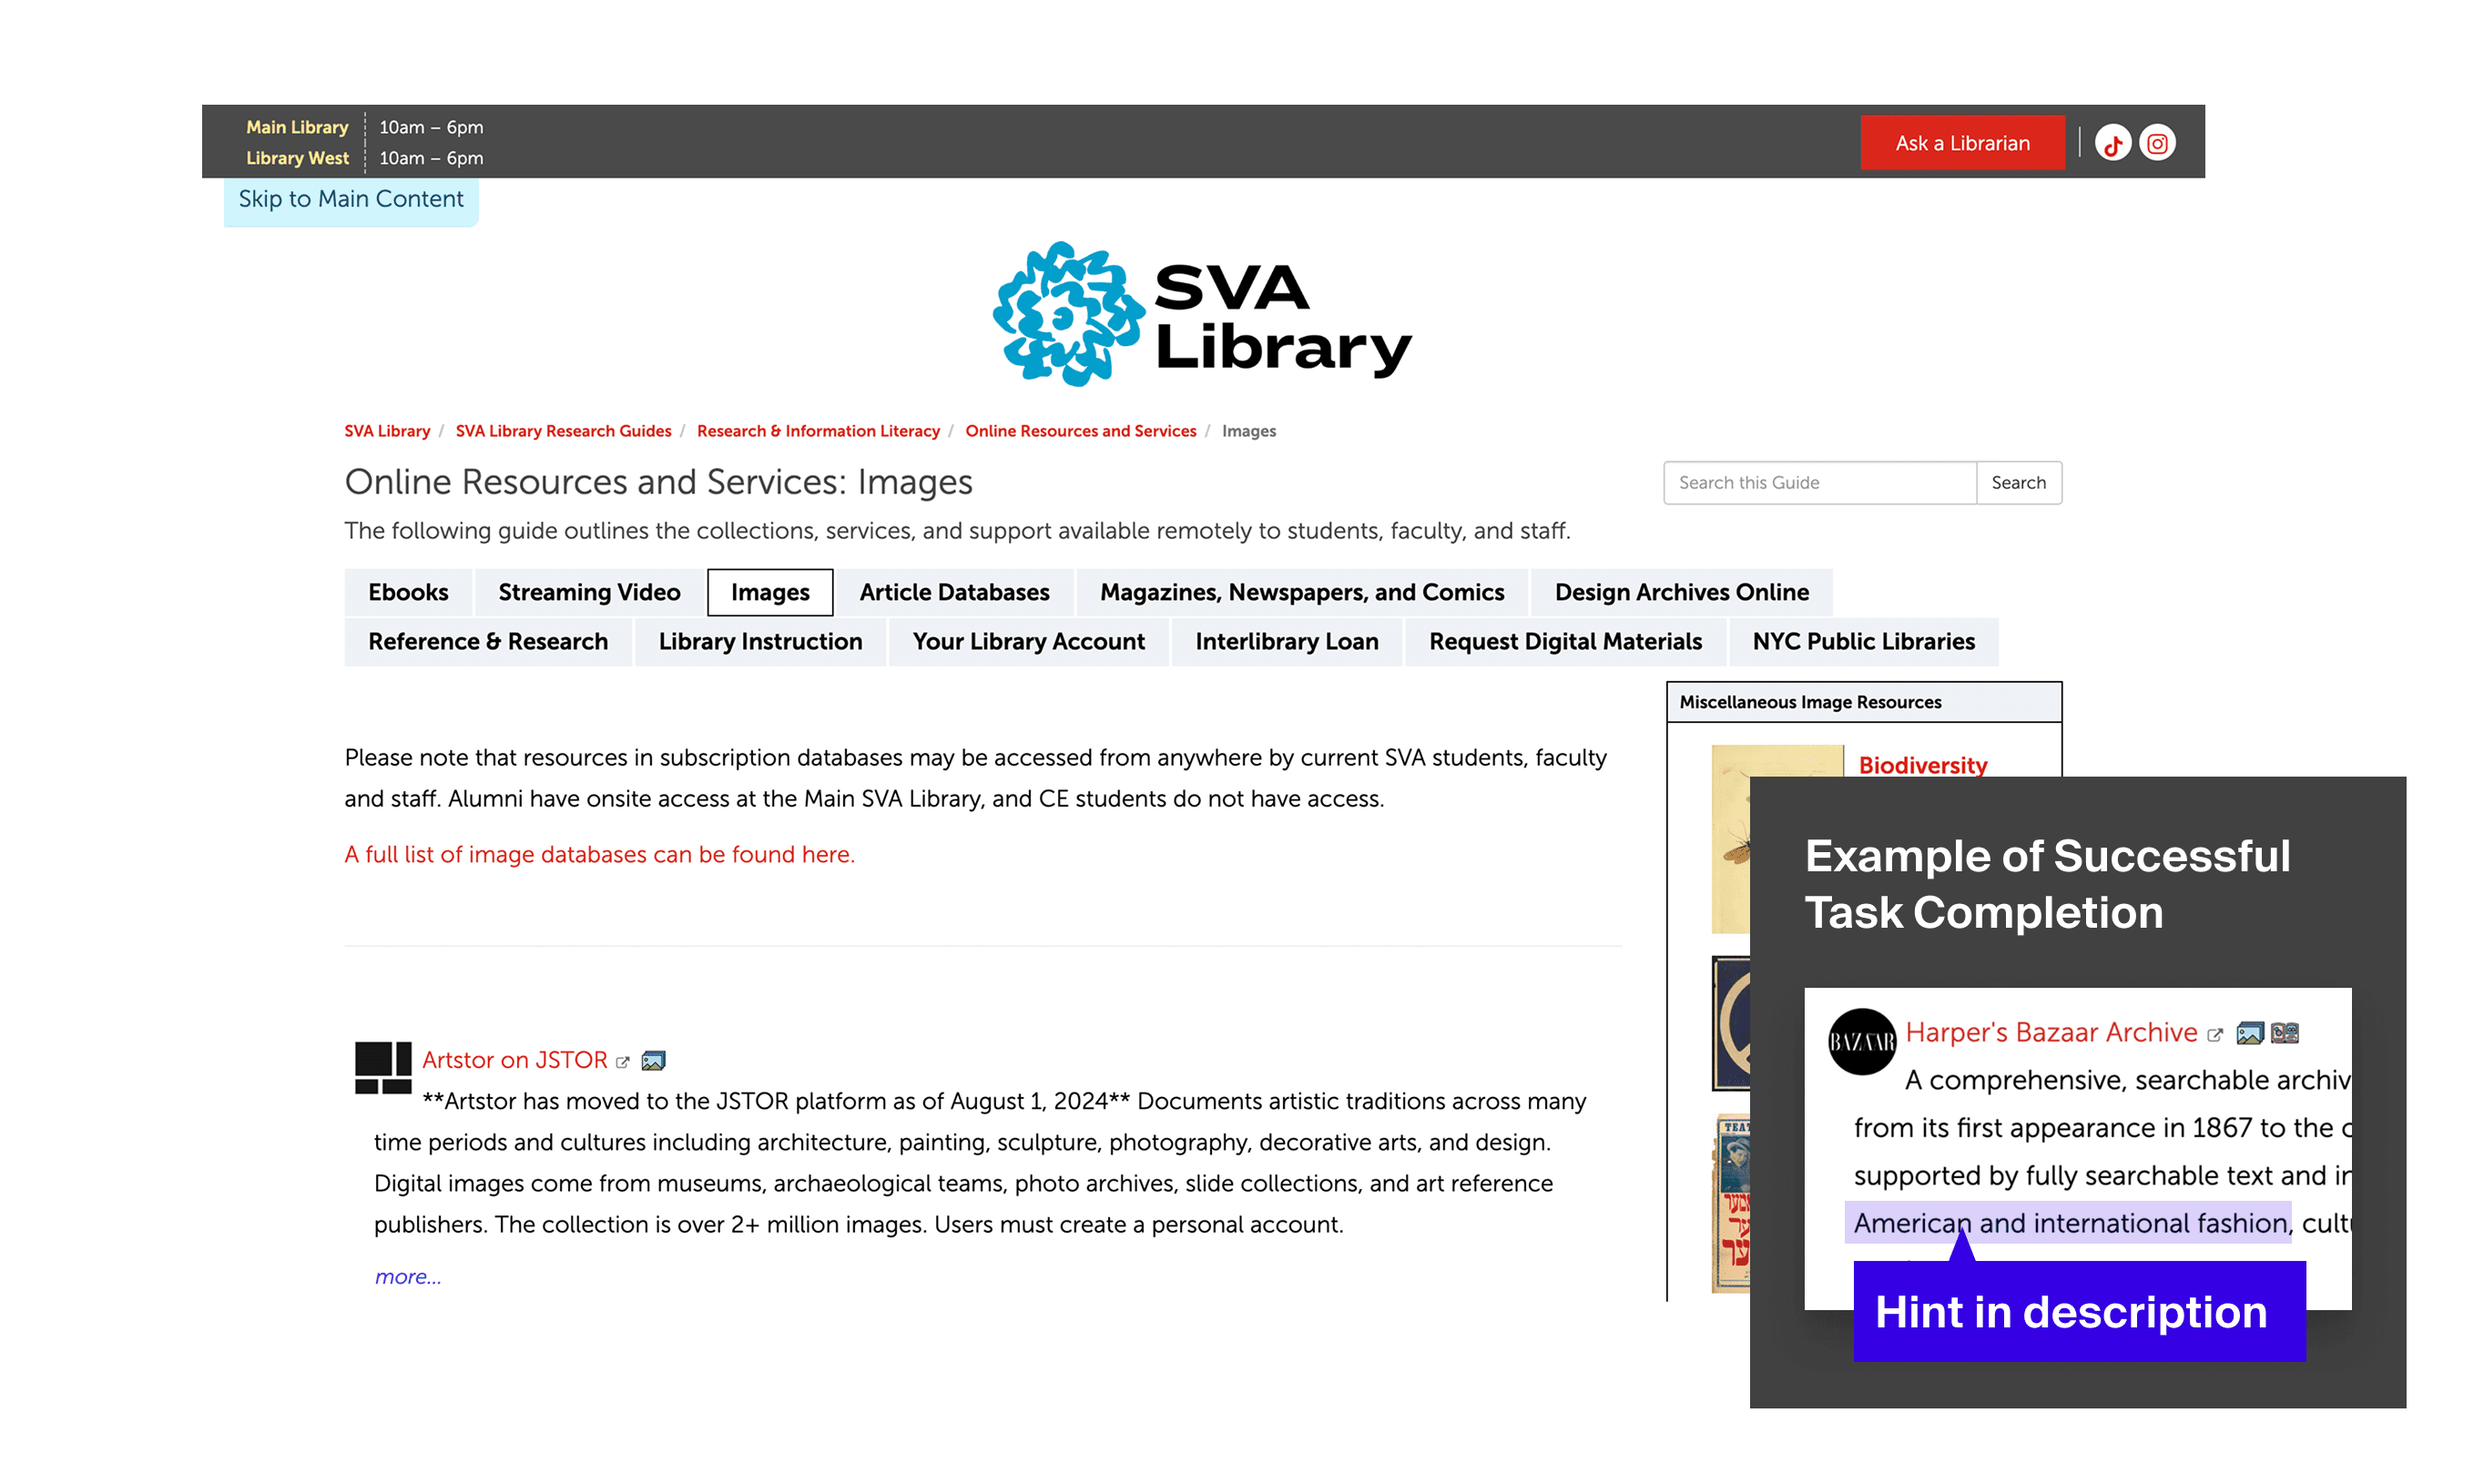
This page showcases the databases available to SVA students.
Why this page?
As the main entry point with the highest traffic, this page had the greatest potential for impact.
Research Question
How effectively can users find, understand, and use the resources for their research needs?
Scenario & Task
The task involved finding a fashion magazine resource for a paper on the history of American fashion.
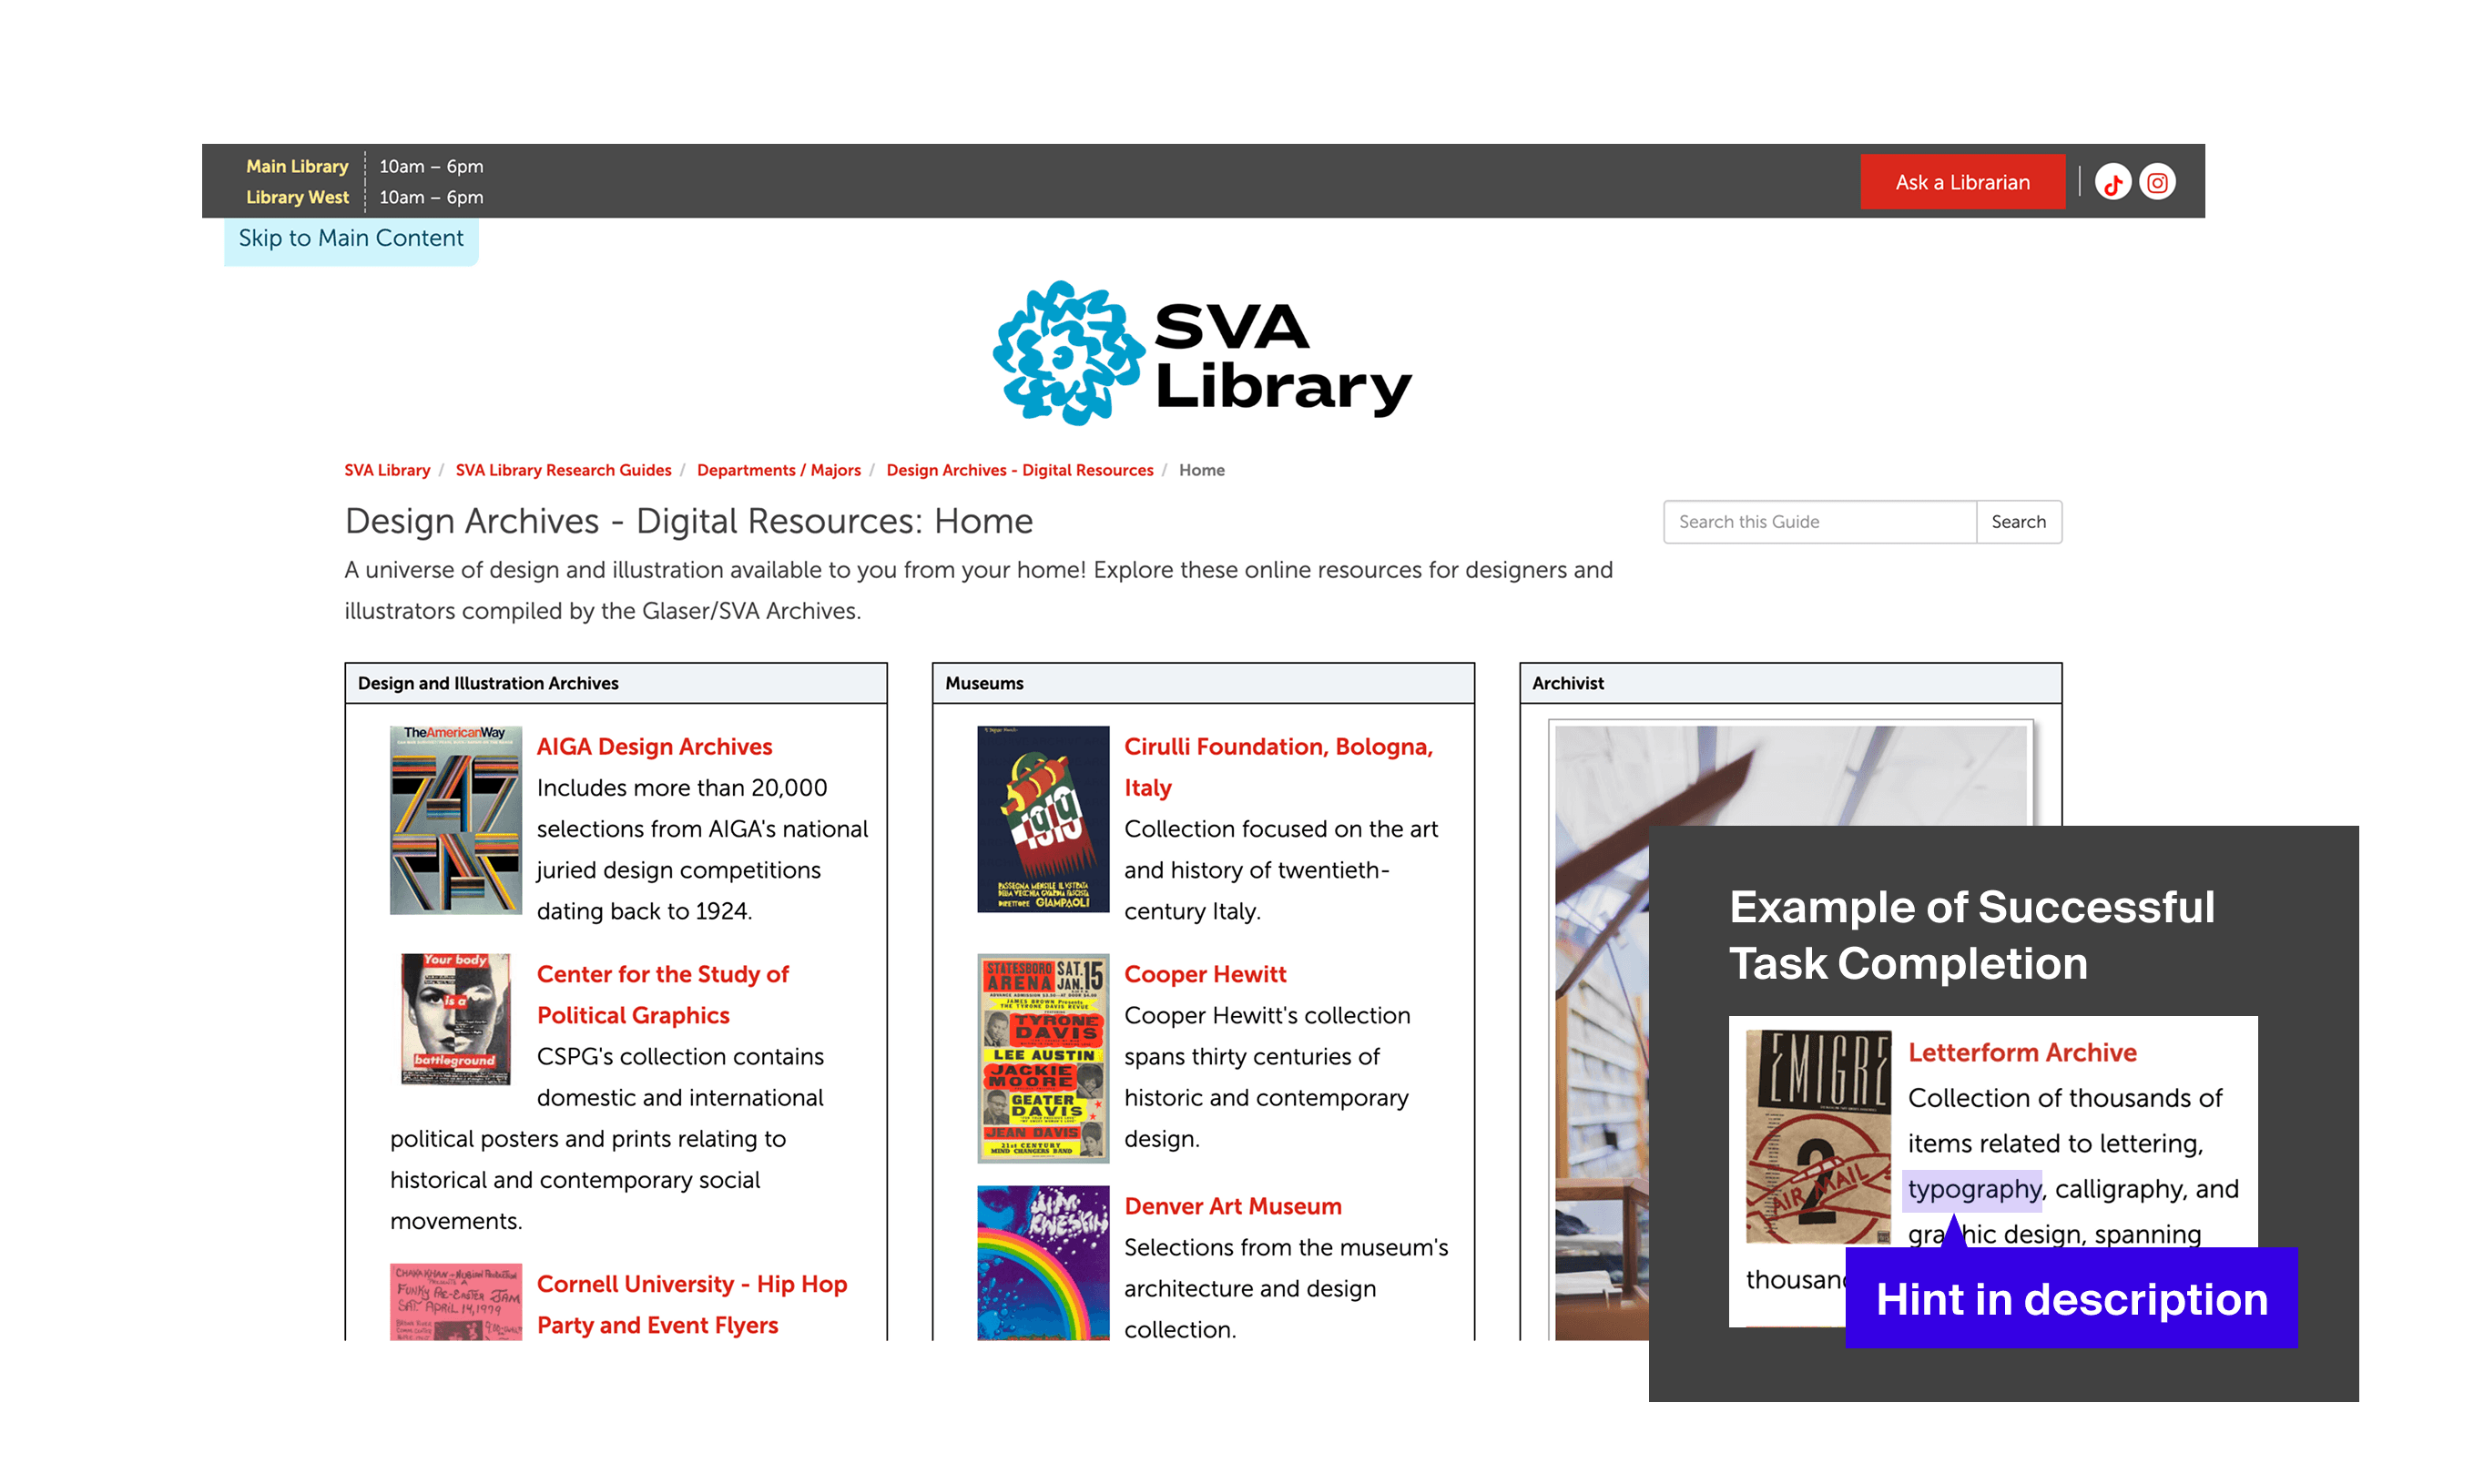
This page provides a list of design archive resources with descriptions.
Why this page?
We asked the client to identify a key page that could be templatized for broader use, and they selected this page.
Research Question
What's the optimal way to organize individual research guides for clarity and ease of navigation?
Scenario & Task
The task was to find a typography resource for a movie poster design as a graphic design student.
Testing & Analysis
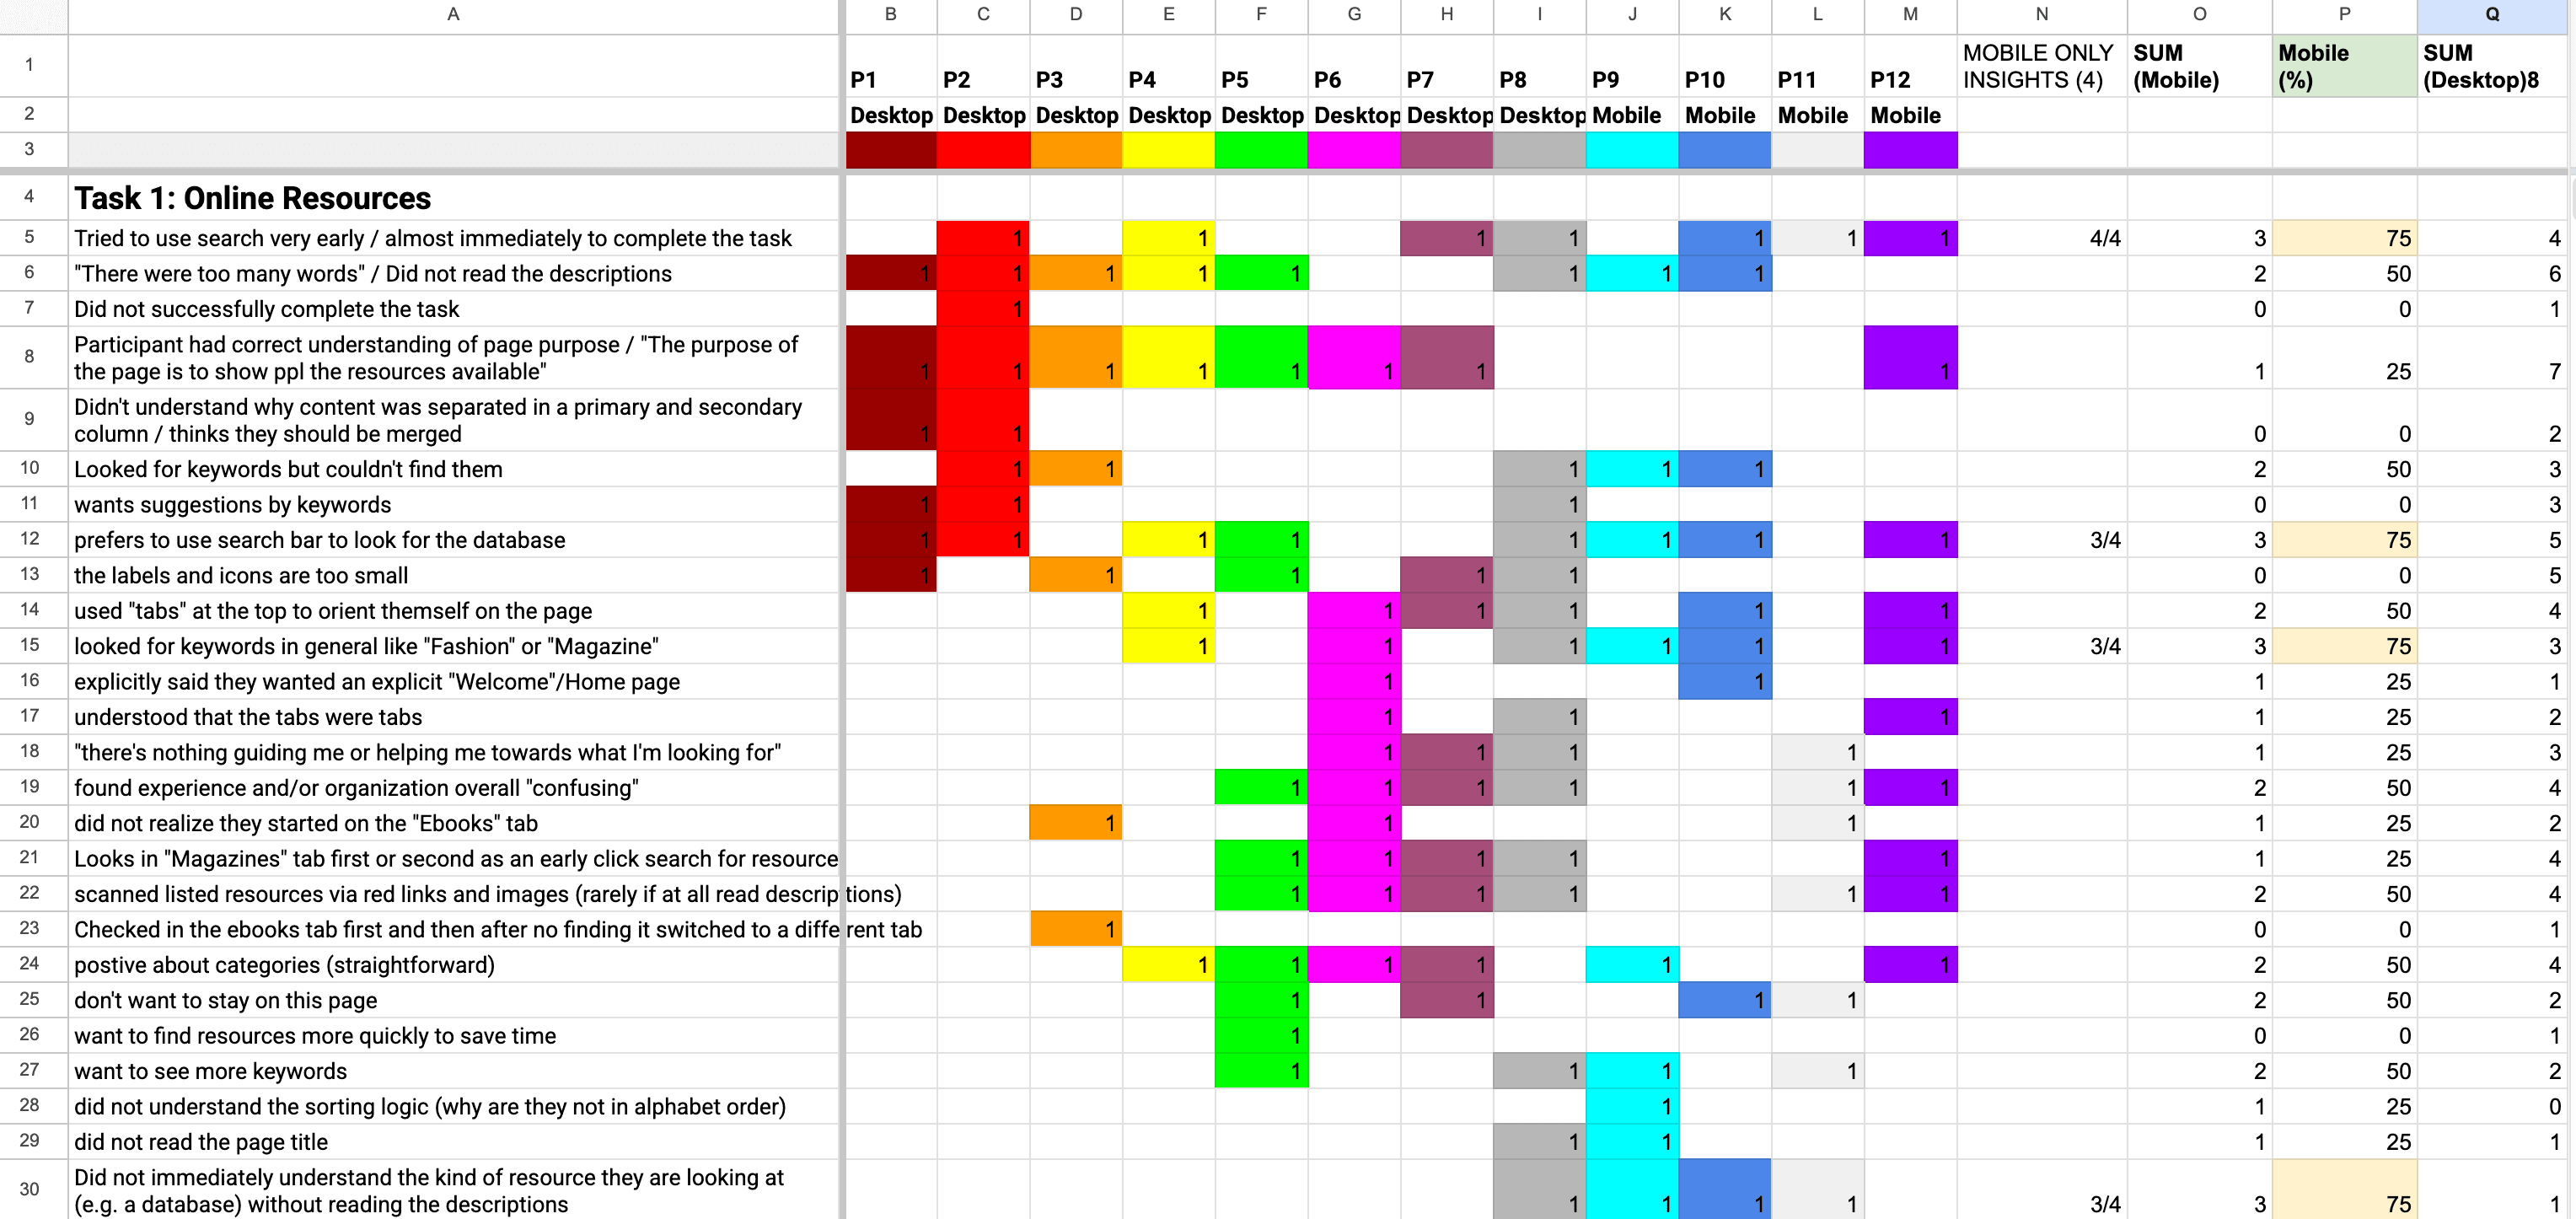
As a first step in our analysis, we used a rainbow sheet to synthesize common behavioral patterns and RTA feedback, giving us a broad overview of the core findings. Next, we triangulated quantitative metrics, eye-tracking data, and user quotes to extract insights and craft the story. Eye-tracking revealed what users actually did; quotes explained why they behaved that way, uncovering their needs; and quantitative metrics quantified the impact and severity of each issue.
Overall Finding
While 79% of students could complete the tasks, SUS score of just 41.3 indicates the user satisfaction of the research guide pages is poor. We identified 2 major UX issues each for the online resources and design archives pages.
79%
Task completion rate
41.3%
System Usability Score
Insight - Online Resource Page
Discovering relevant databases is difficult without prior knowledge due to search and skim difficulties.
In the testing sessions, we identified that users prefer to use the search bar because they expected the search bar could show them the related resources sooner, like they experience in other websites.
67
%
Mentioned the preference for search
50
%
Searched immediately during the task
2.37
min
Average time on task
I would wish that the search bar can just immediately take me there. I don't want to spend time looking at everything.
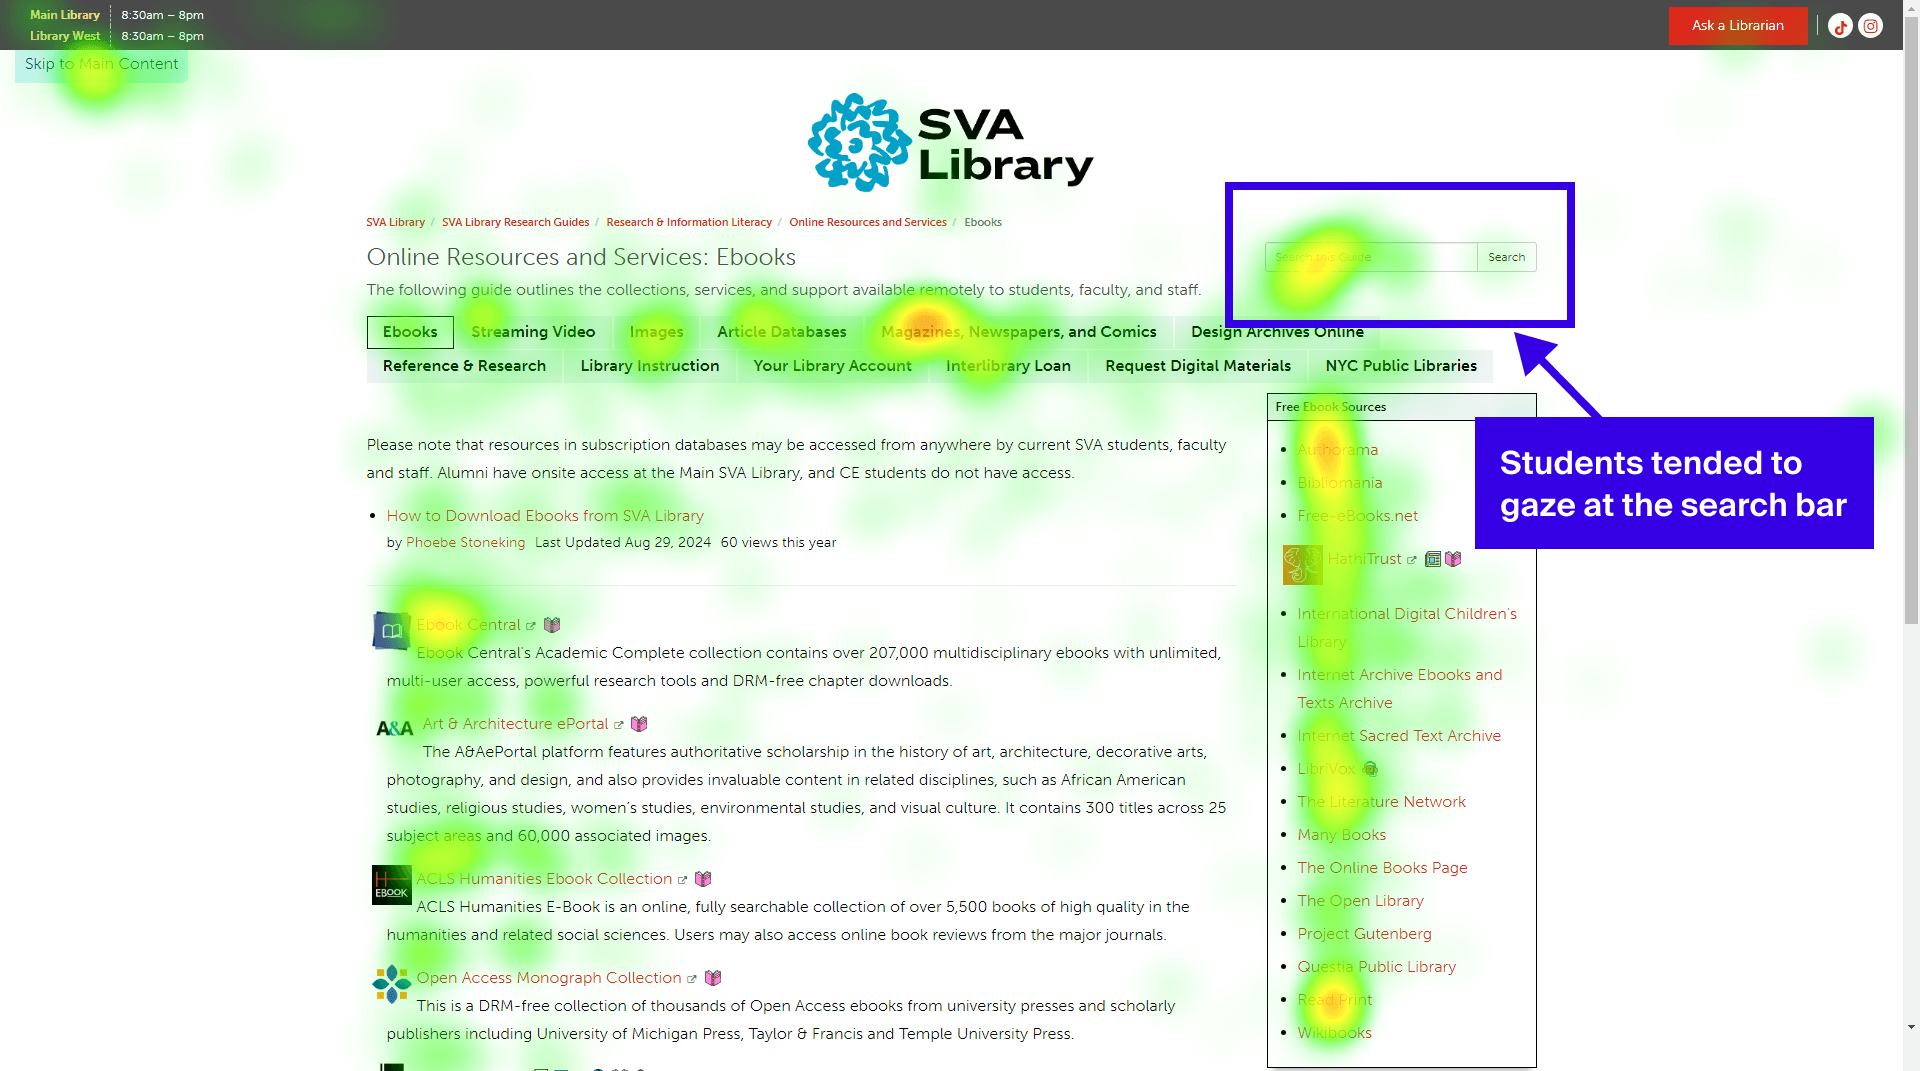
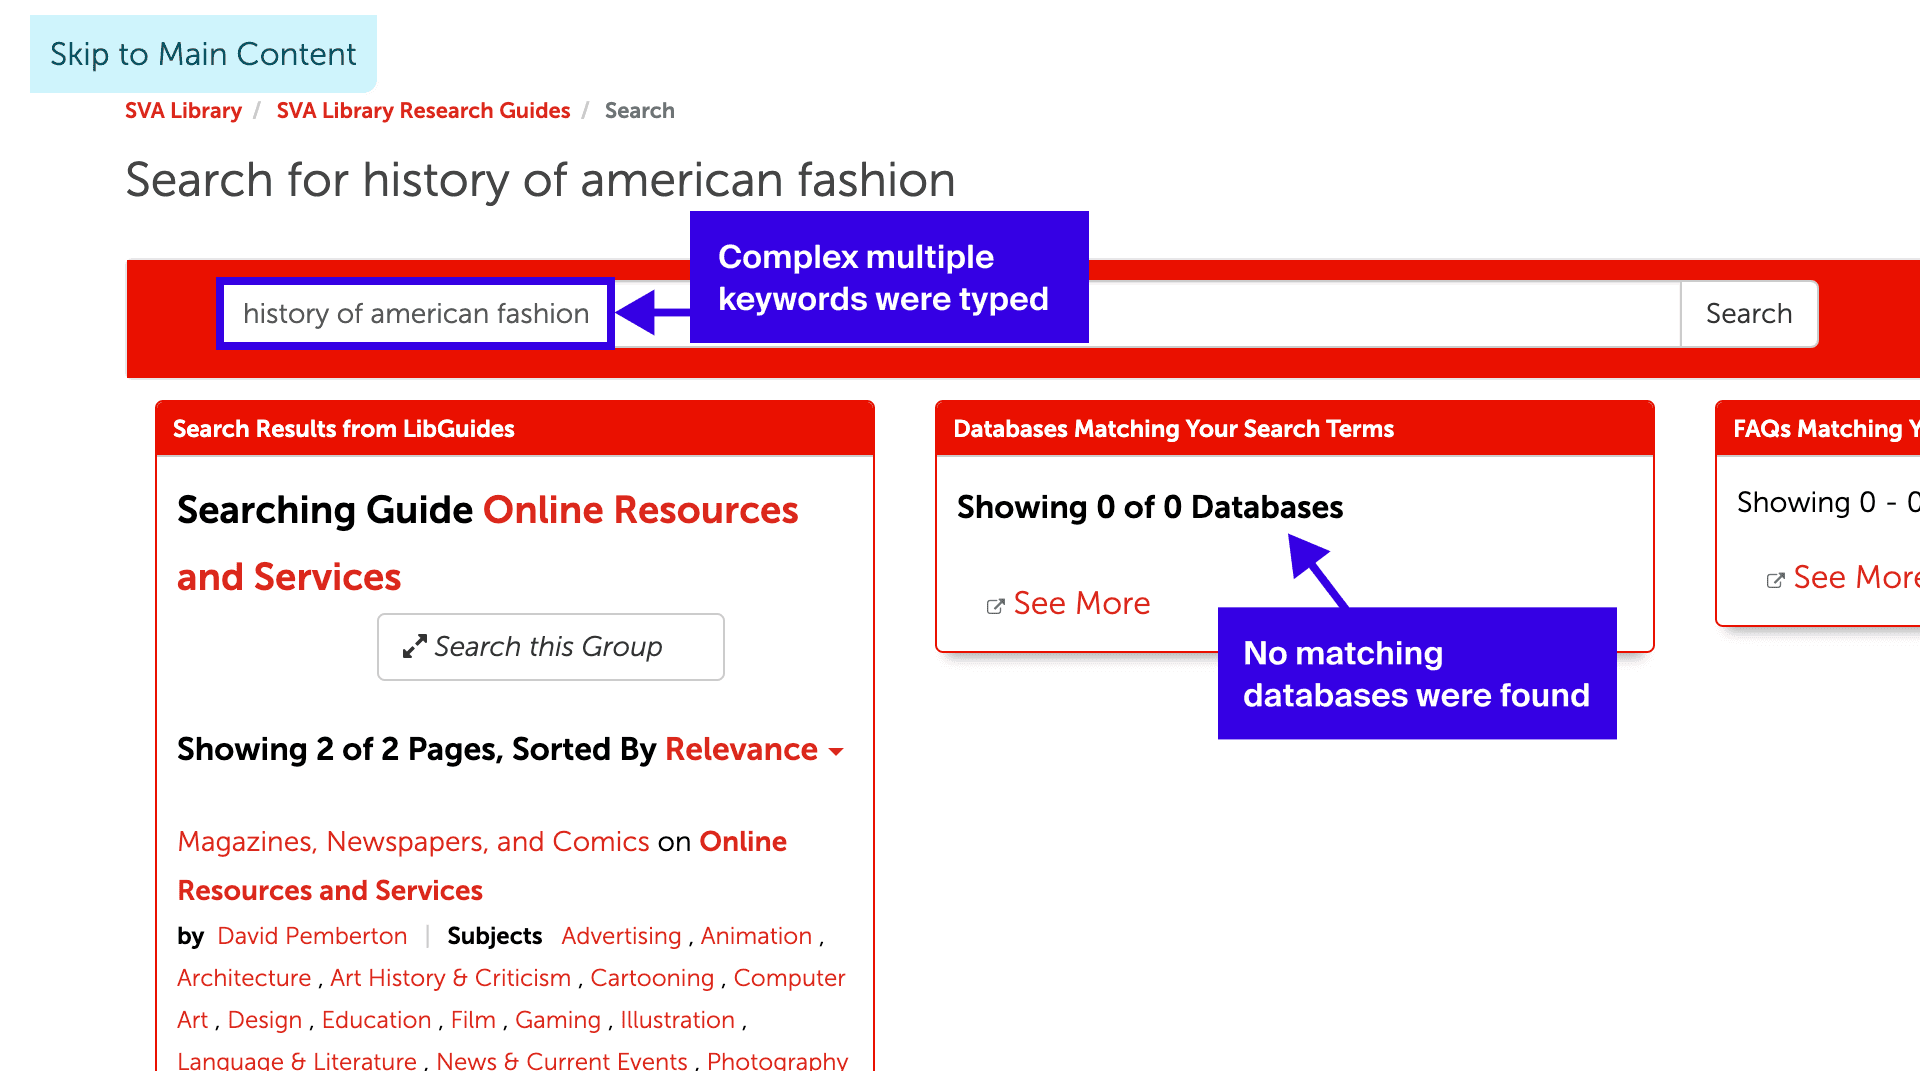
Students often try to search, but the current functionality fails to return relevant databases when keywords are complex, such as those with multiple words or typographic errors.
67
%
Got NO matching database result from search bar (among participants who tried search)
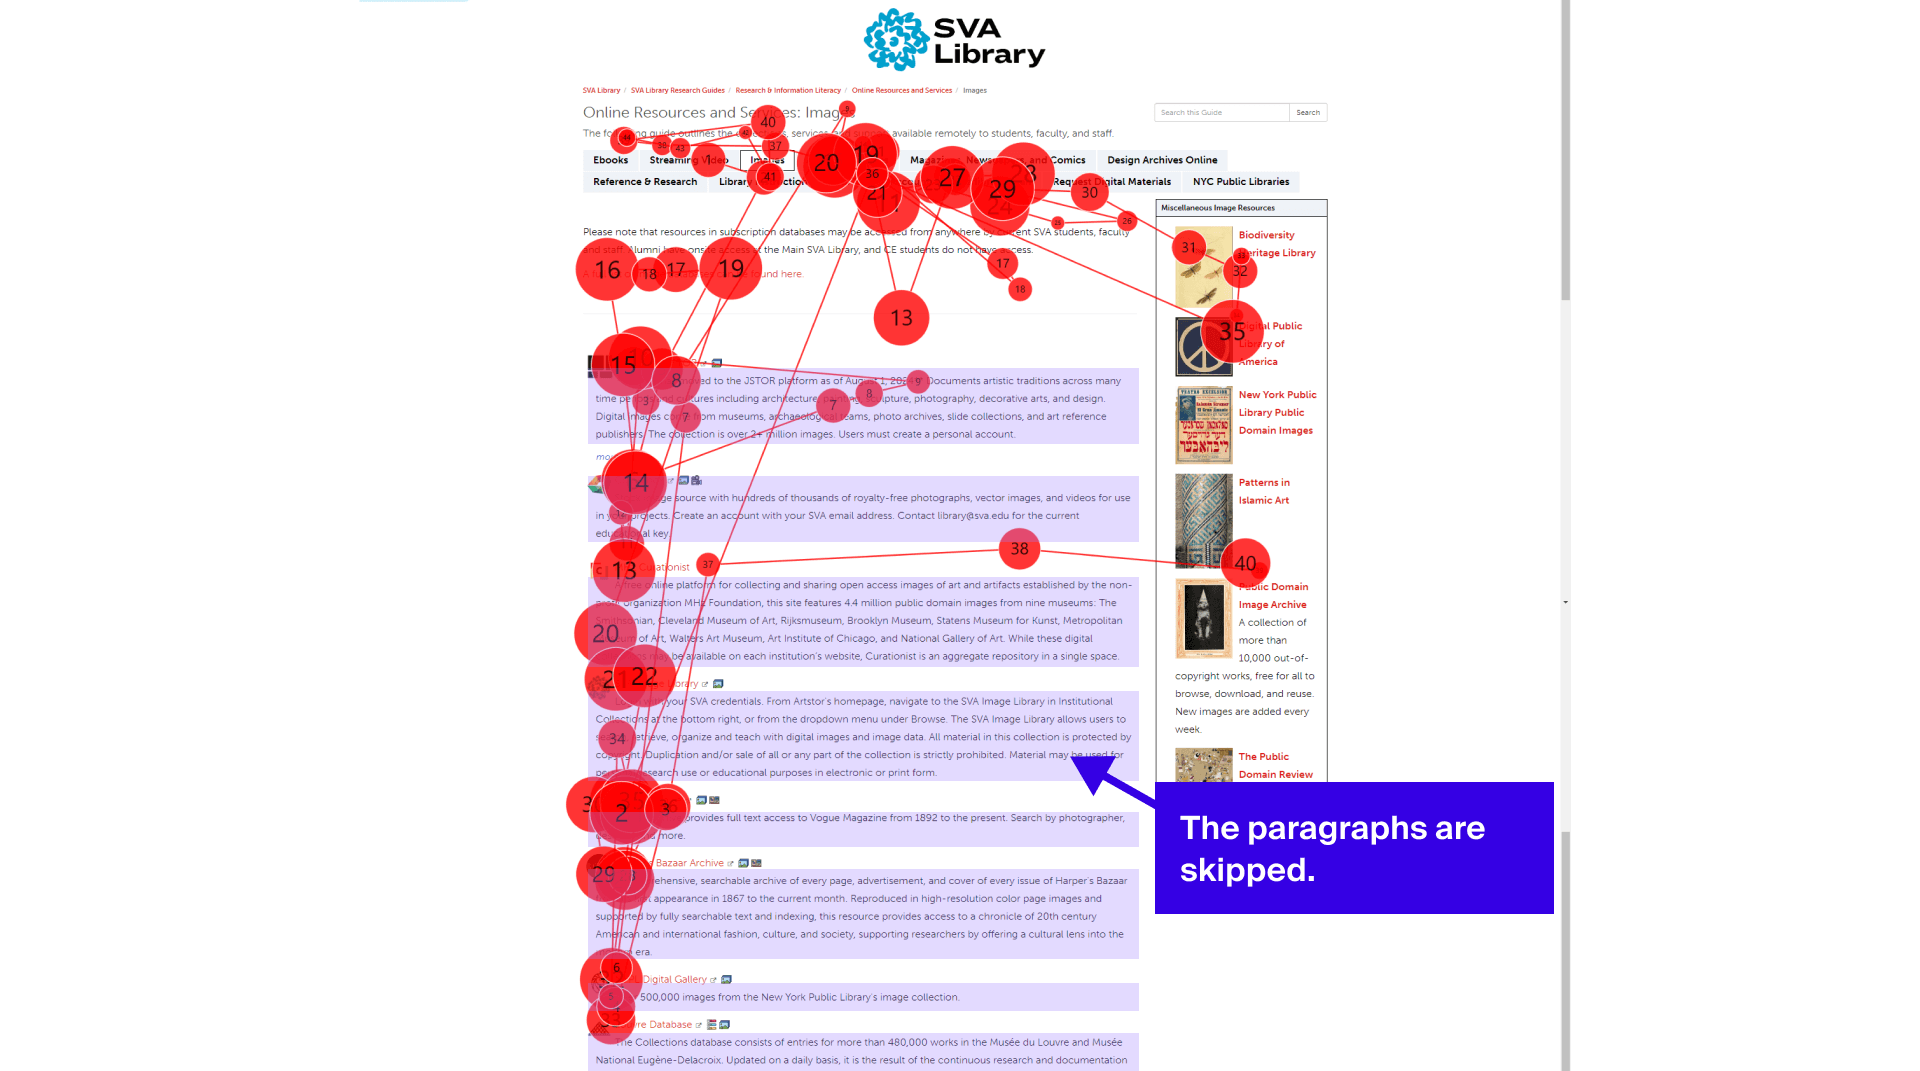
Instead of using the search bar, students attempted to skim the page, but the dense text and lack of information hierarchy made this difficult.
67
%
Mentioned information overload issue
I'm someone who's not very like patient, especially text. So this amount of, small text, I don't want to read it.
Recommendation #1
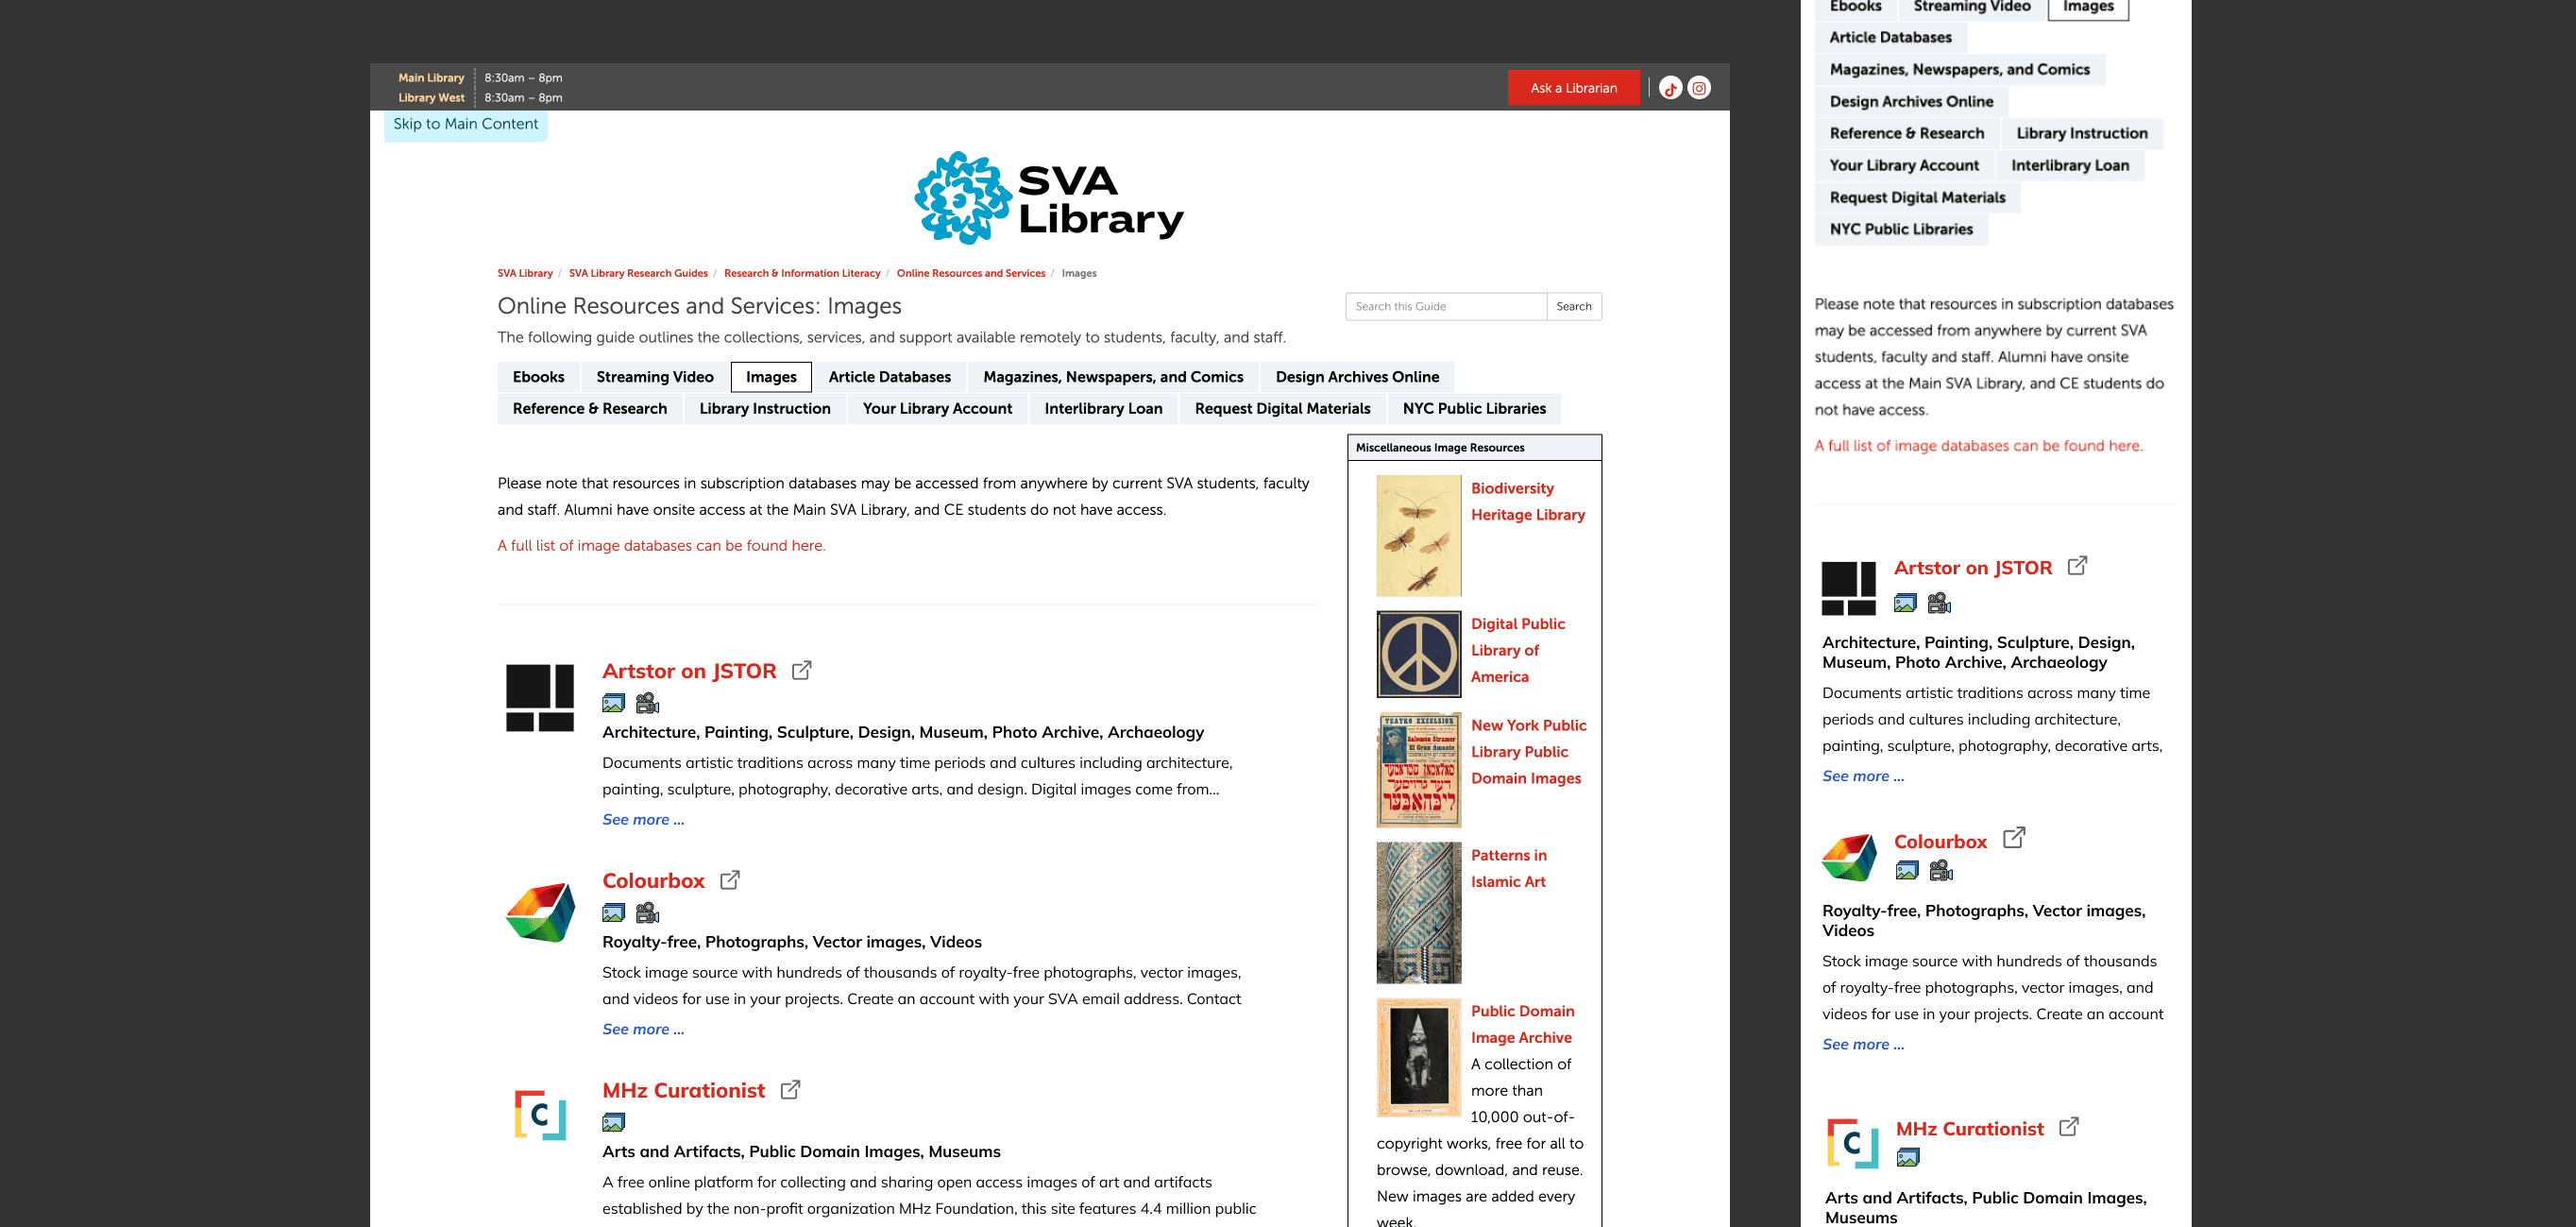
First, I recommended fixing the search bar functionality. As a quicker, easier improvement, I also suggested making the content more skimmable to help students understand each database and identify those relevant to their research. Specifically, I proposed increasing logo size, enhancing the font size and weight of database labels, adding short keywords, and reducing descriptive text.
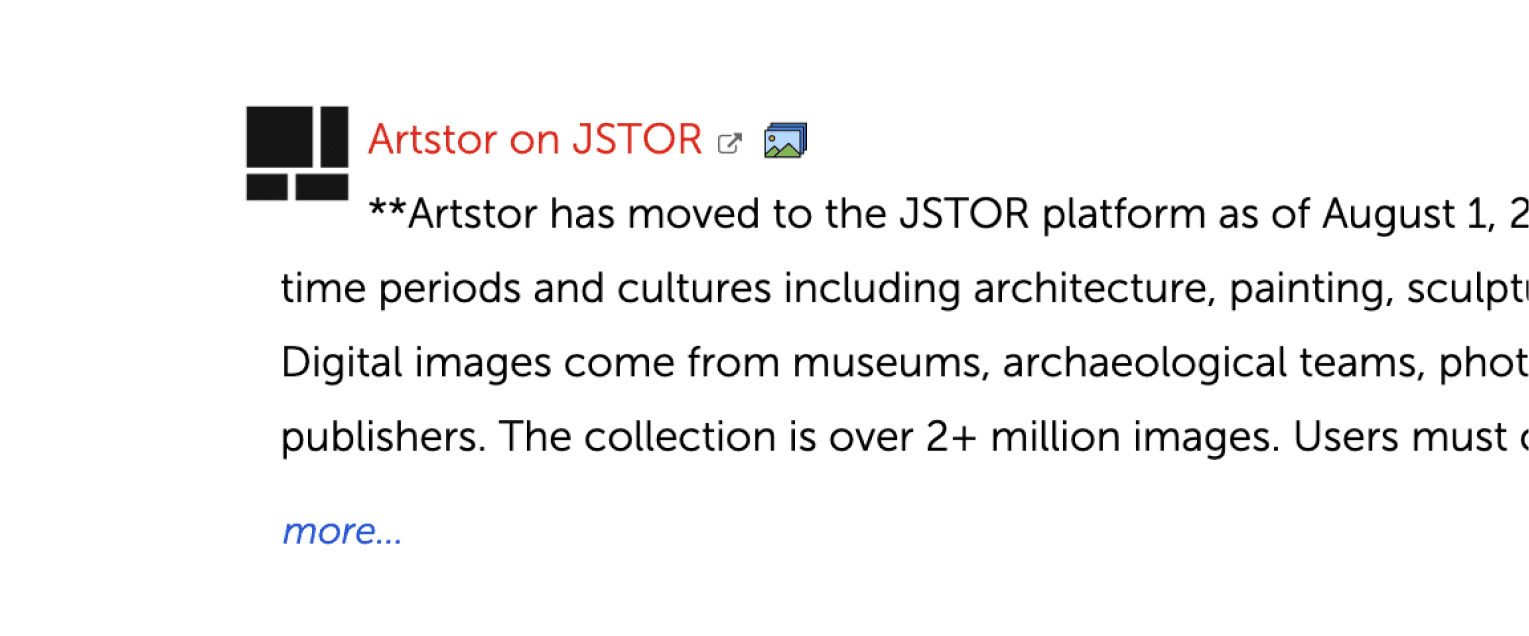
The lack of visual hierarchy and excessive text made the content difficult to skim.

Visual hierarchy and reduced text help minimize information overload, allowing users to quickly skim database overviews using keywords.
Recommendation #2
I recommended enhancing the search functionality to be more robust, regardless of the keywords used, for example, by better handling complex queries and correcting typographic errors.
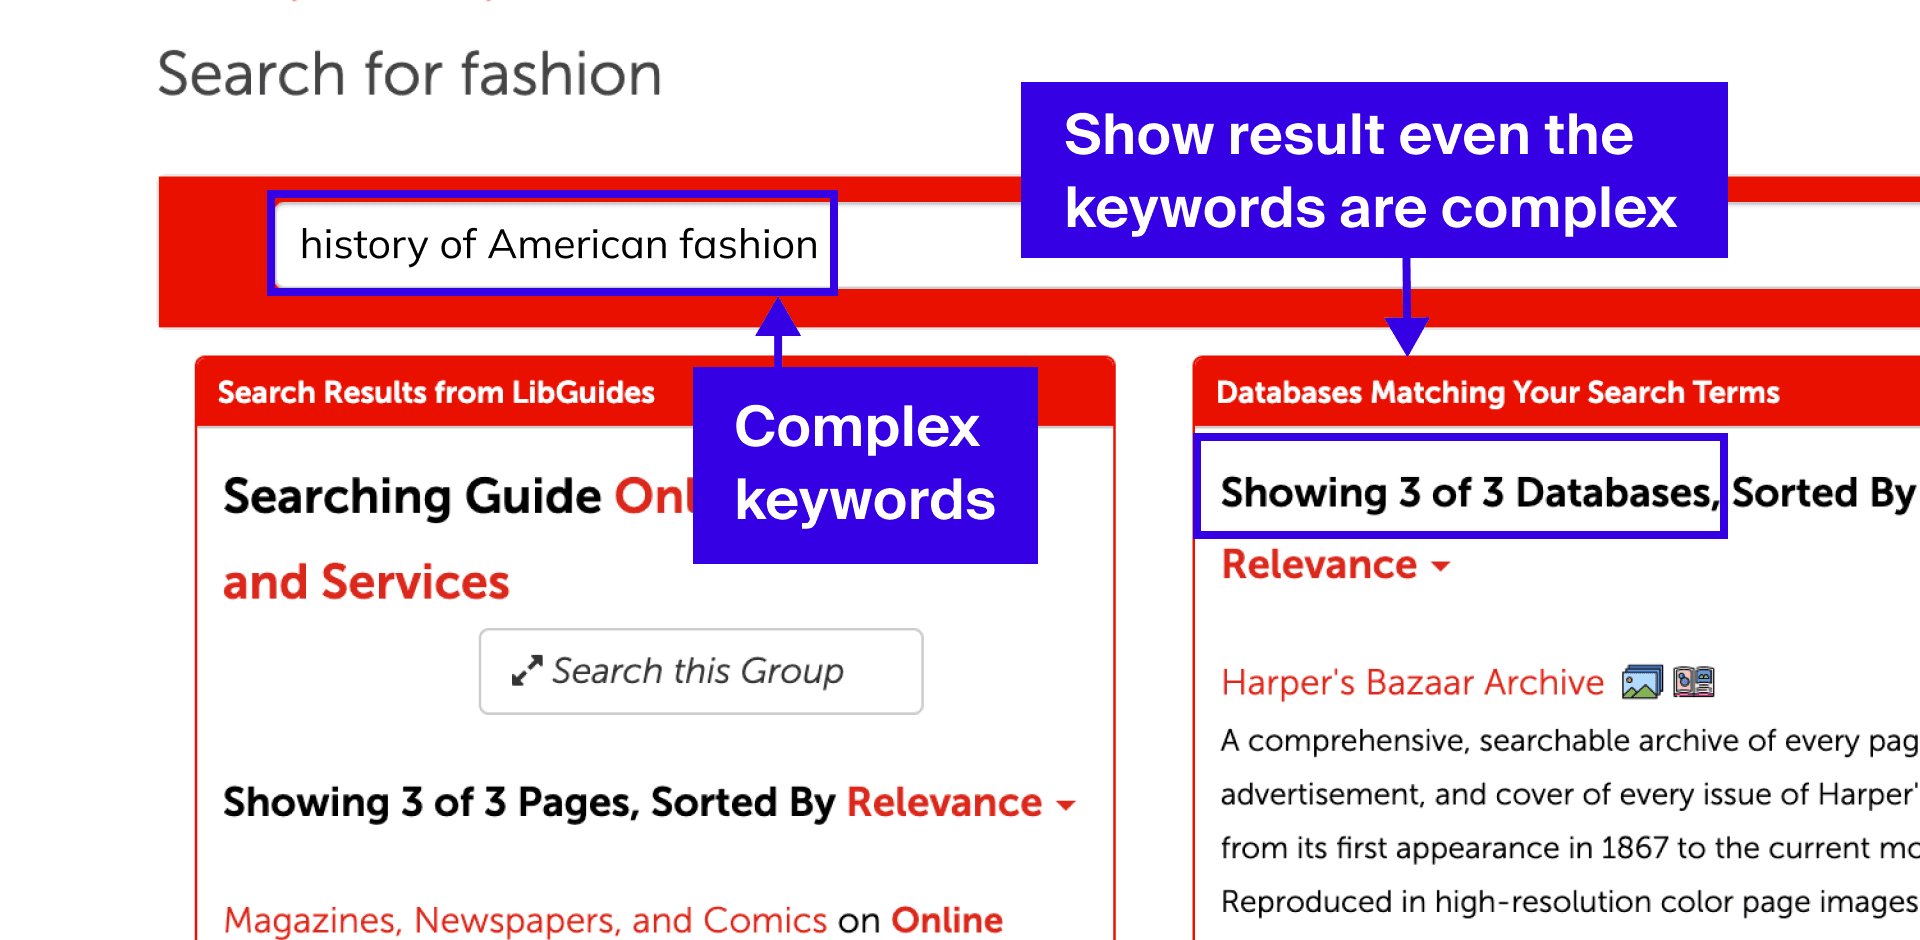
Allow multiple keywords in the search bar.
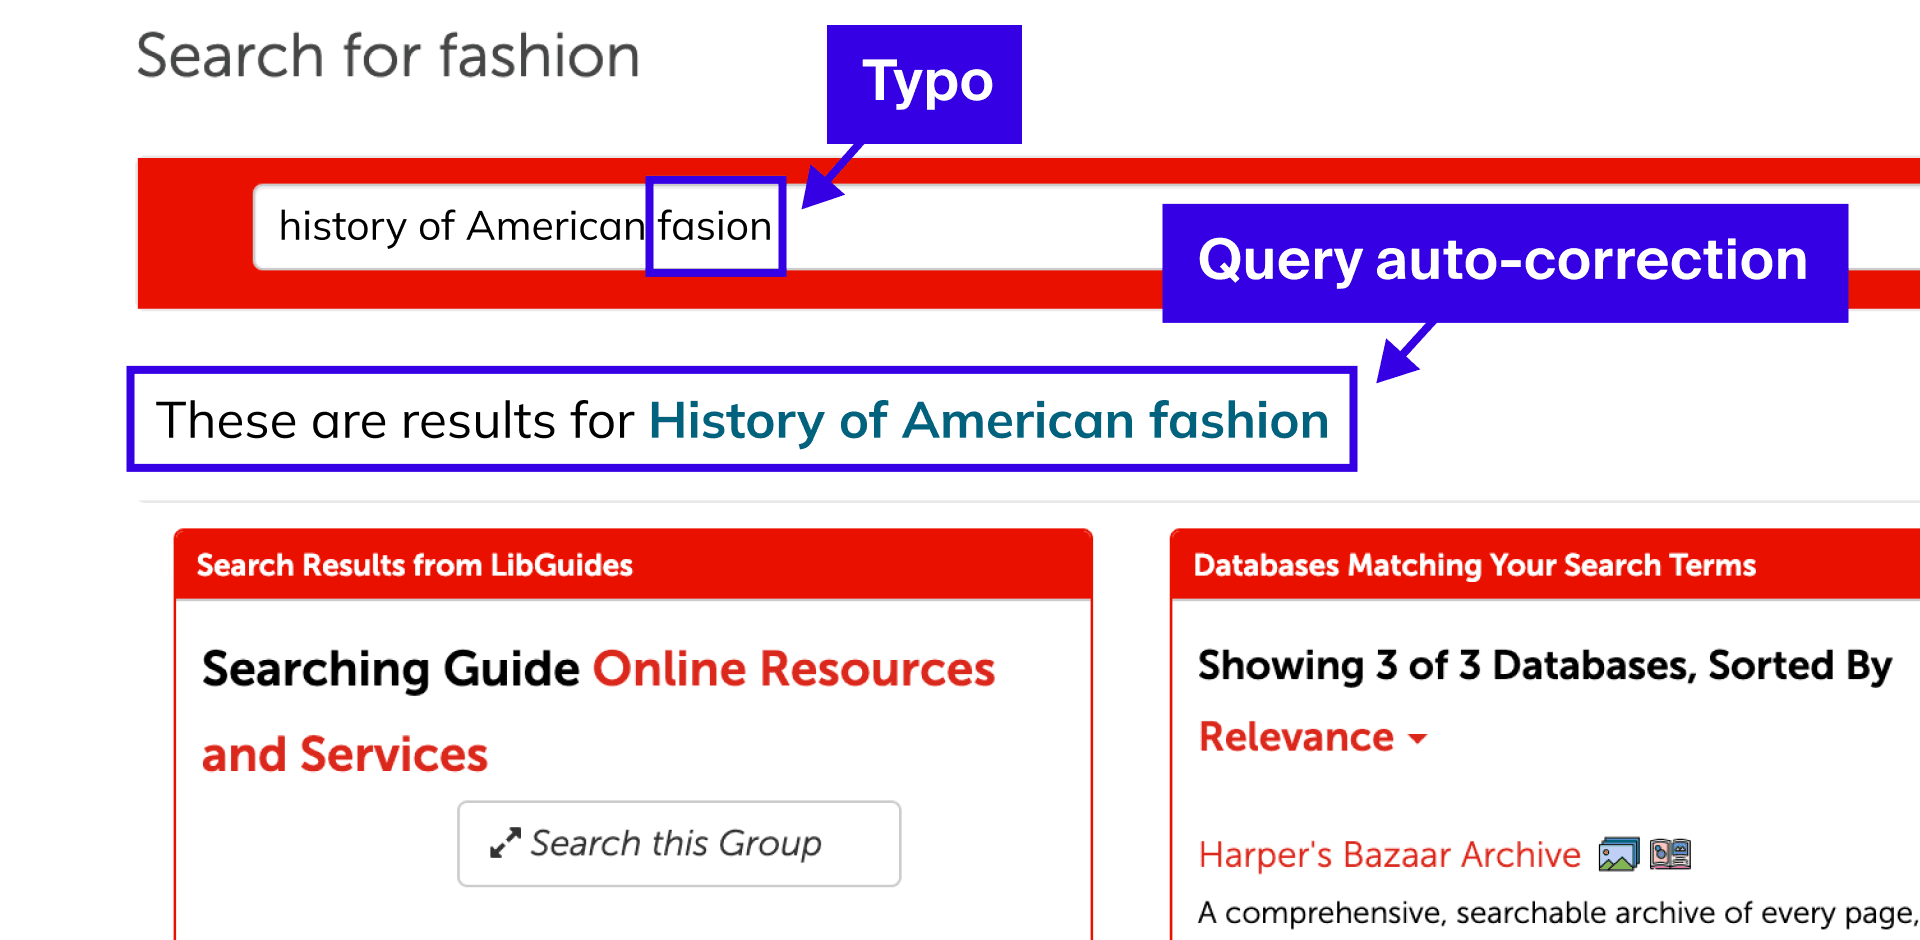
Make search bar robust to typographic errors.
Insight - Design Archives Page
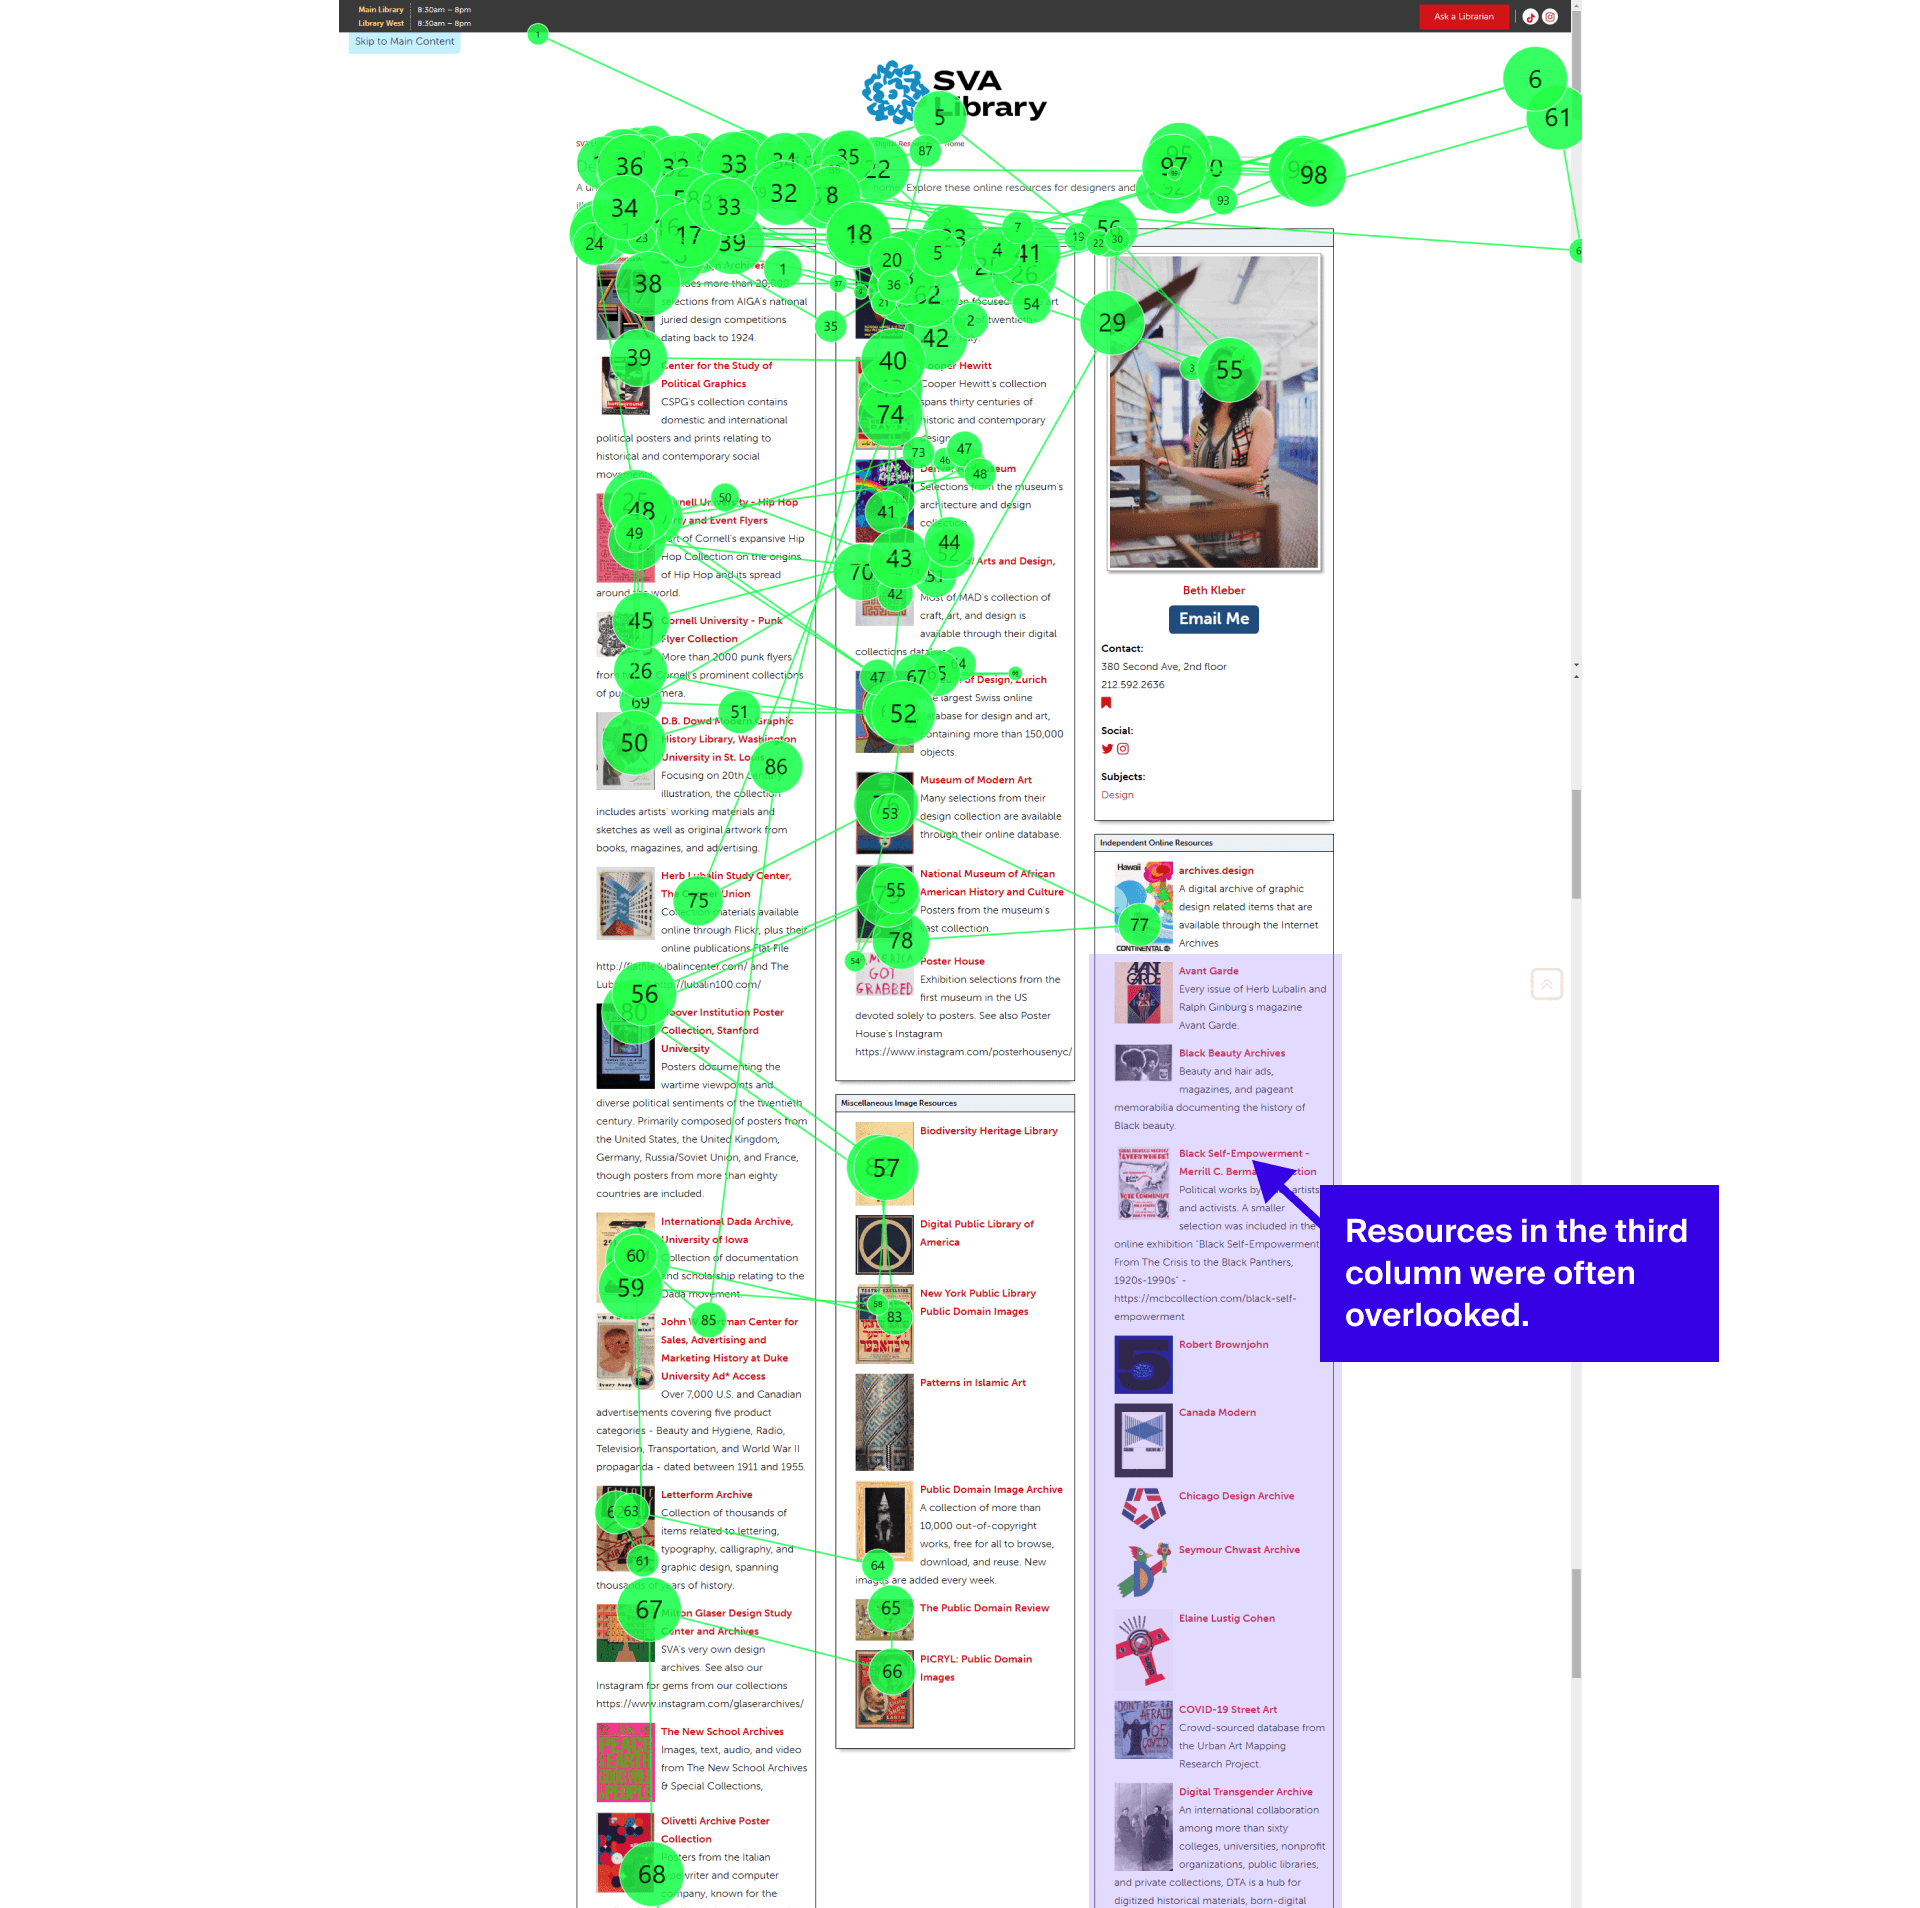
Resources in the third column and below the fold often go unnoticed.
Many students navigated the page without grasping how columns were divided by category. The labels were too small to see, and the categories themselves were unclear and sometimes overlapped, offering no reliable cues to help users focus their search.
83%
Mentioned the issues related to the column labels
It isn't clear how these columns are separated, and sometimes their categories overlap.
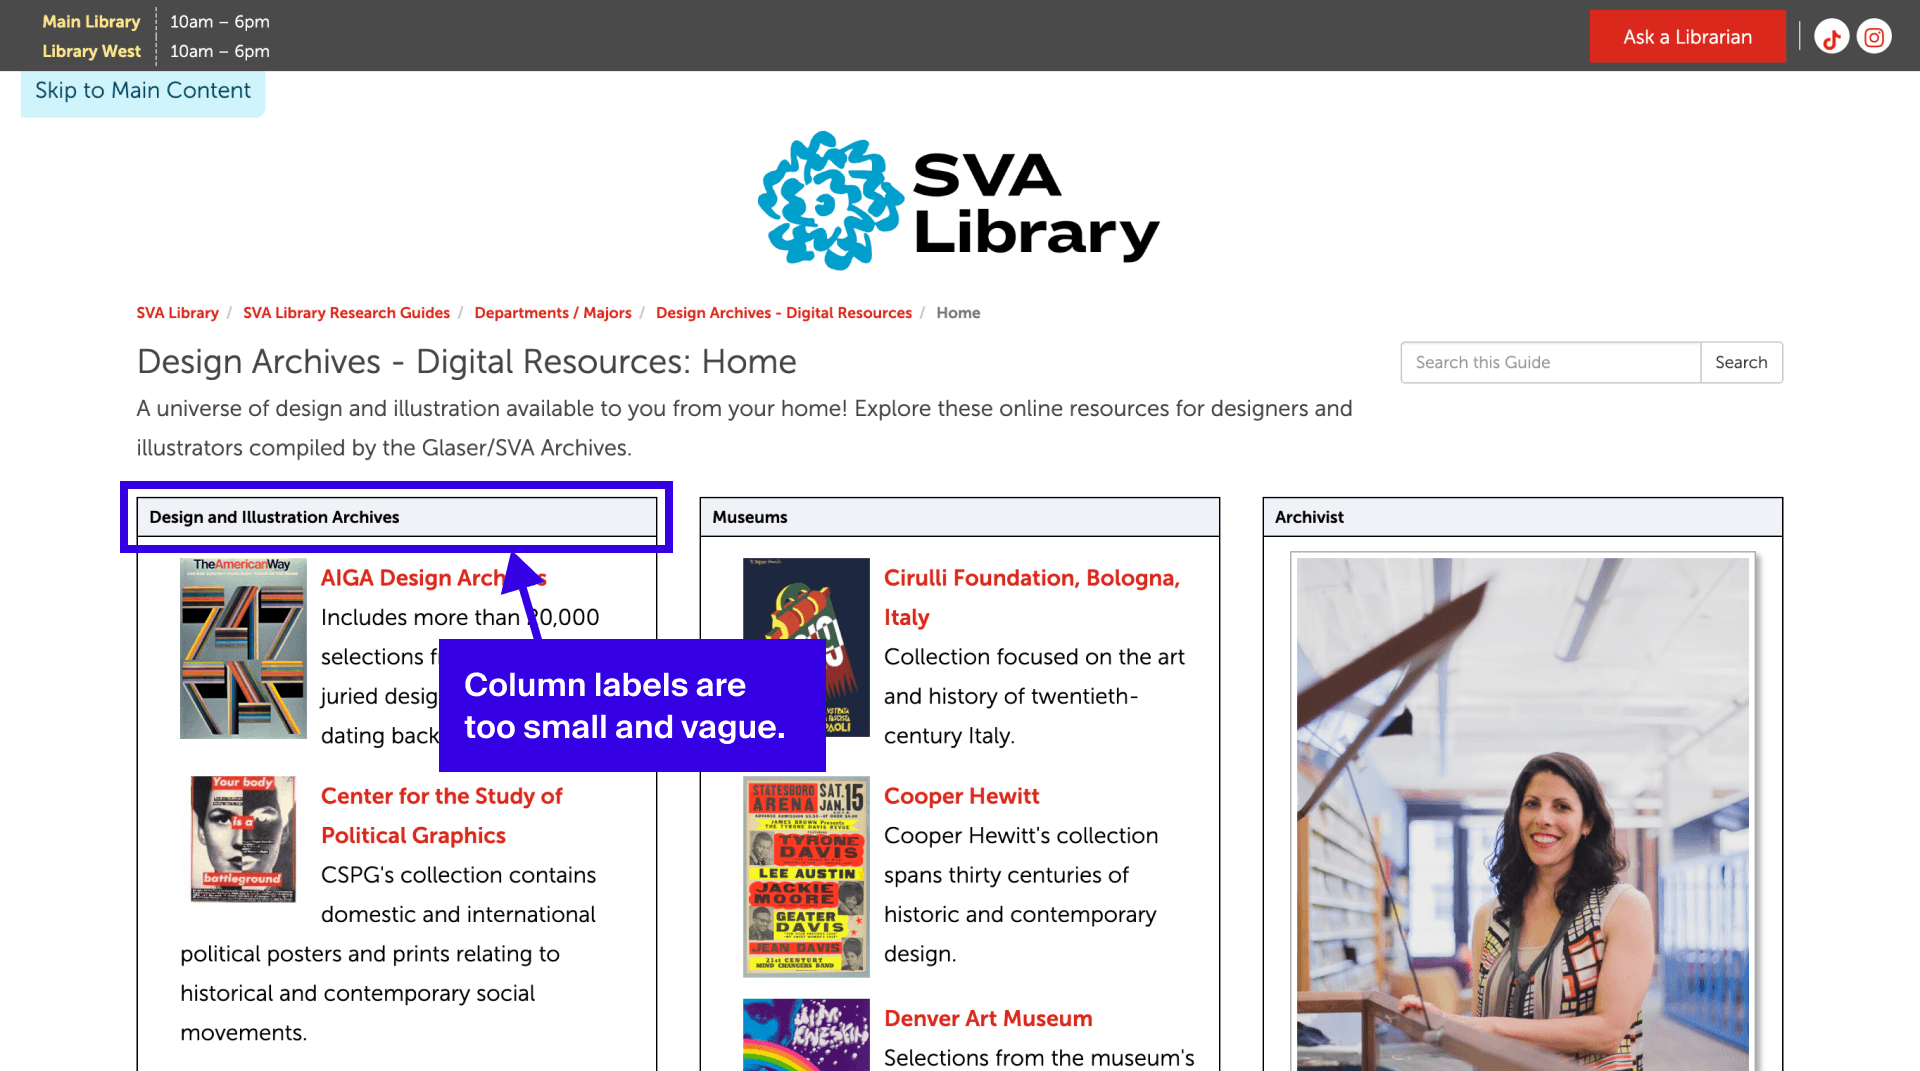
Because there was no clear category focus, many users scrolled inconsistently between columns. They often had to scroll back up multiple times to catch skipped resources, affecting efficiency. More importantly, the layout created unexpected attention gaps, with the third column receiving less attention than the first two columns.
It was like shopping at a market. I had to go from column to column.
Recommendation #3
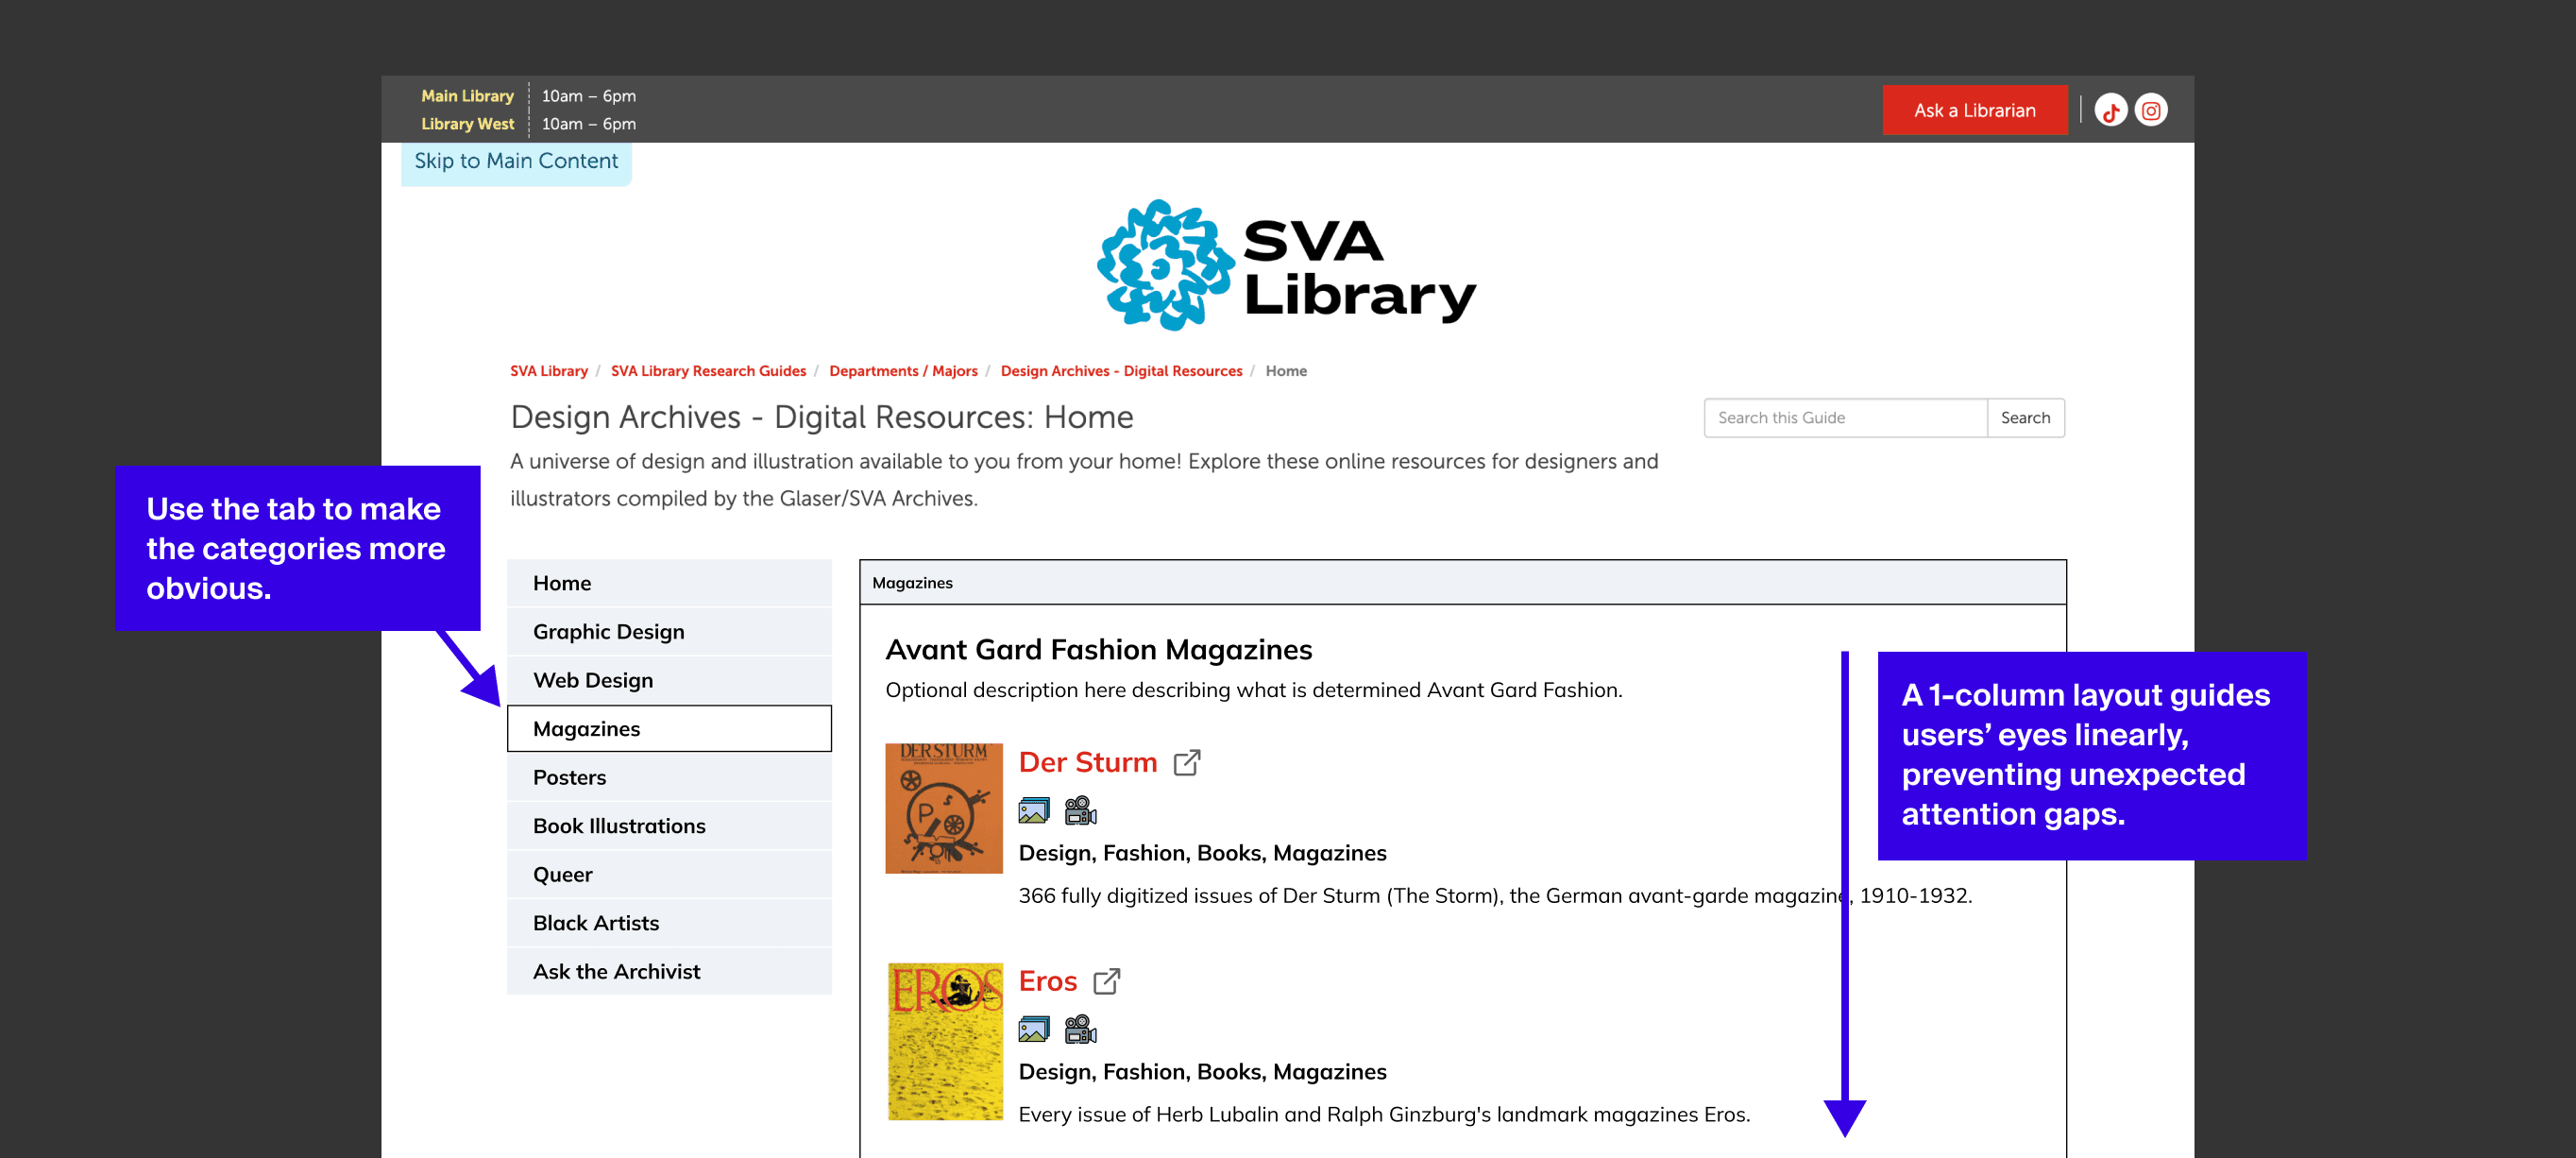
We recommended using the existing tab component to group resources, making categories more visible and ensuring feasibility. We also advised switching to a single-column layout so users don't have to jump between columns, which enhances efficiency and eliminates unexpected attention gaps.
Impact
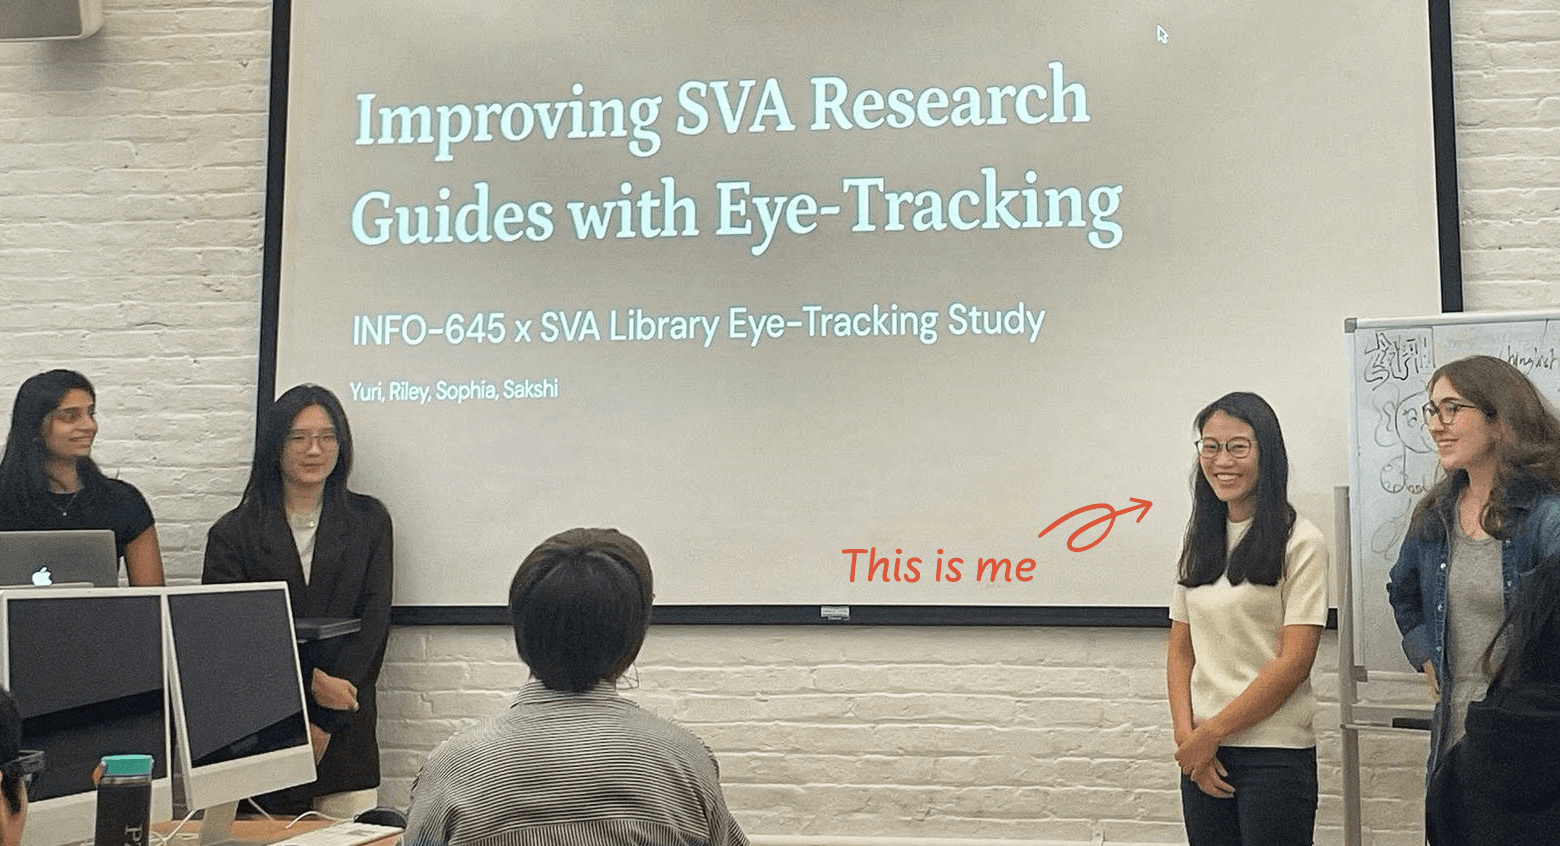
At the end of the project, we presented our research findings and recommendations to the client and shared Slide deck, Problem list, Video reel, and Visual summary. They found our insights both interesting and helpful. Despite website constraints and a limited timeframe, we successfully focused on high-impact areas and delivered recommendations applicable to other research guides, as reflected in the following client quote.
We can use these suggestions to apply system-wide updates to all of our guides.
SVA Library Librarian
Reflection
This project helped me connect quantitative metrics, eye-tracking behavior, and user quotes into a clear UX story. I want to keep using this skill to make research insights easier to act on as a product designer.
I would like to test whether the recommendations improve the experience through follow-up evaluation methods such as A/B testing.